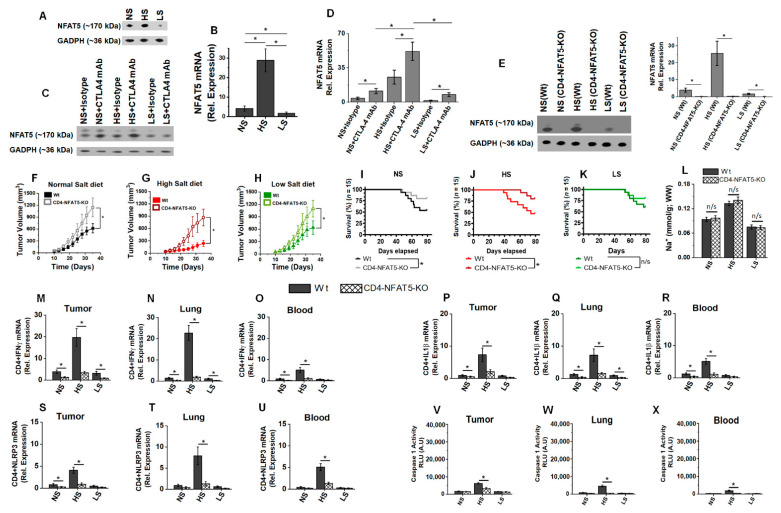
Figure 6.
NFAT5 is the upstream modulator of inflammasome activation in high-salt-mediated irAE response. (A) Western-blot-based protein analysis for NFAT5 expression in CD4+T cells isolated from tumor-infiltrating immune cells in NS, HS and LS diet cohorts. (B) qRT-PCR-based NFAT5 mRNA expression in CD4+T cells isolated from tumor-infiltrating immune cells in NS, HS and LS diet cohorts. (C,D) Western-blot- (C) and qRT-PCR- (D) based analysis of NFAT5 expression in CD4+T cells isolated from tumor-infiltrating immune cells in NS, HS and LS diet cohorts following treatment with anti-CTLA4 mAb or isotype control. (E) Transgenic murine model with CD4 specific NFAT5 knock out (CD4-NFAT5-KO) in C57Bl/6 background were utilized for further breast tumor studies. Western blot analysis confirmed the lack of NFAT5 expression in our CD4-NFAT5-KO model. (F–H) Tumor progression kinetics in NS (F), HS (G) and LS (H) cohorts in wild-type (Wt) and CD4-NFAT5-KO transgenic mice injected with syngeneic Py230. Data presented as mean ± SEM, n = 8 (biological replicates); statistical analysis was performed using multiple t-test, (*) p-value < 0.05; n/s = not significant. (I–K) Survival rate in the three salt-modified diet cohorts—NS (I), HS (J) and LS (K)—in breast-tumor-bearing Wt and CD4-NFAT5-KO mice followed for 80 days. The n =15 per cohort, statistical analysis performed by log-rank Mantel–Cox comparison. (L) CD4-specific knock out of NFAT5 did not change the tumor [Na+] accumulation. (M–O) The mRNA expression of IFNγ in CD4+T cells isolated from tumor (M), lung (N) and blood (O) of Wt and CD4-NFAT5-KO in NS, HS and LS diet cohorts. (P–R) The mRNA expression of IL1β in CD4+T cells isolated from tumor (P), lung (Q) and blood (R) of Wt and CD4-NFAT5-KO in NS, HS and LS diet cohorts. (S–U) The mRNA expression of NLRP3 in CD4+T cells isolated from tumor (S), lung (T) and blood (U) of Wt and CD4-NFAT5-KO in NS, HS and LS diet cohorts. (V–X) Caspase-1 activity CD4+T cells in tumor (V), lung (W) and blood (X) from Wt and CD4-NFAT5-KO in NS, HS and LS diet cohorts. Data analyzed by one-way ANOVA for multiple comparisons; data presented as mean ± SEM, n = 8 (biological replicates) per cohort, (*) p-value < 0.05.

