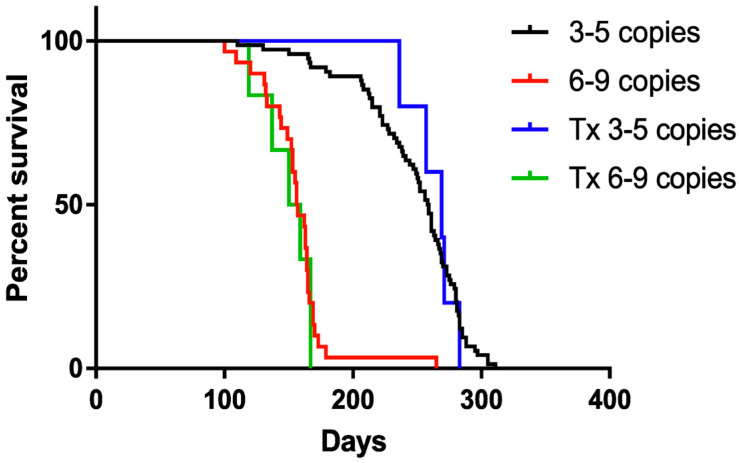
Figure 3.
Kaplan–Meier curve presenting the lifespan of transplanted and nontransplanted animals. Sample size within the SOD1/rag2 nontransplanted groups: n = 74 (3–5 copies), n = 30 (6–9 copies), and within the SOD1/rag2 transplanted groups: n = 5 (3–5 copies), n = 6 (6–9 copies); p-value < 0.0001 (log-rank Mantel–Cox test).

