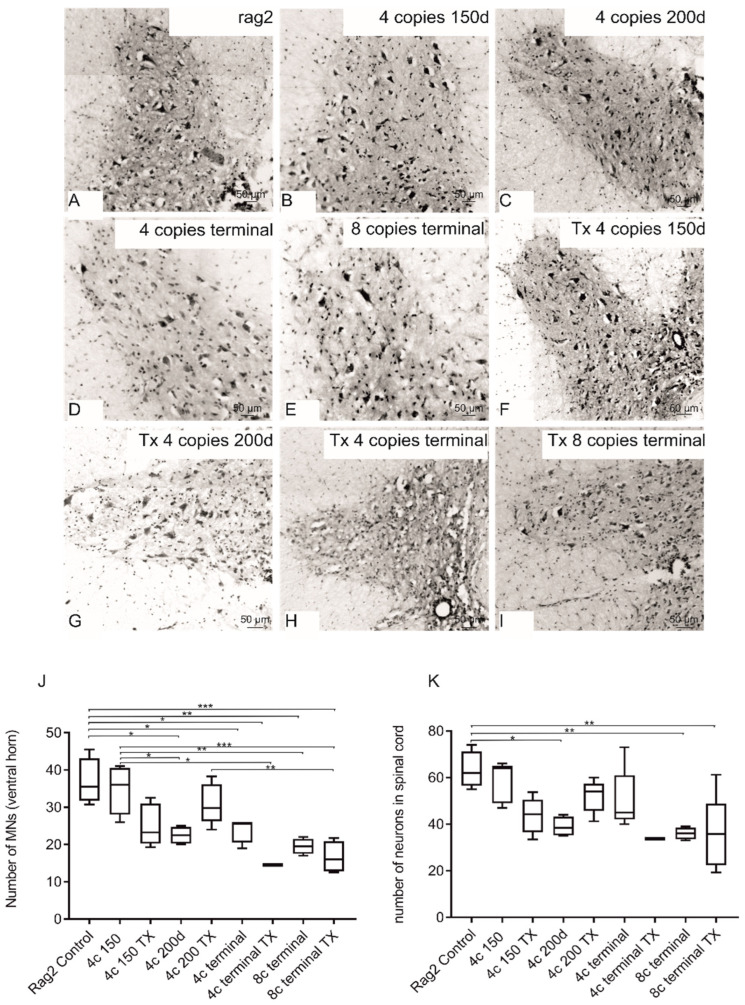
Figure 5.
Morphological analysis of MNs in spinal cords of transplanted (F–I) and nontransplanted animals (B–E) compared with rag2 control (A) show reduced number and size of MNs in SOD1 comparison with rag2 animals. Quantitative analysis (J,K) did not reveal diminished MN counts in transplanted animals (J) as well as in the total number of neurons in the spinal cord (K). The following symbols of the level of statistical significance were adopted: p < 0.05 *; p < 0.01 **; p < 0.001 ***. Values are presented as mean ± SD. Sample size within the Rag2 control group: n = 4; SOD1/rag2 nontransplanted 4-copy group at 150 days: n = 5; SOD1/rag2 transplanted 4-copy group at 150 days: n = 4; SOD1/rag2 nontransplanted 4-copy group at 200 days: n = 4; SOD1/rag2 transplanted 4-copy group at 200 days: n = 6; SOD1/rag2 nontransplanted 4-copy terminal group: n = 5; SOD1/rag2 transplanted 4-copy terminal group: n = 1; SOD1/rag2 nontransplanted 8-copy terminal group: n = 4; SOD1/rag2 transplanted 8-copy terminal group: n = 4.

