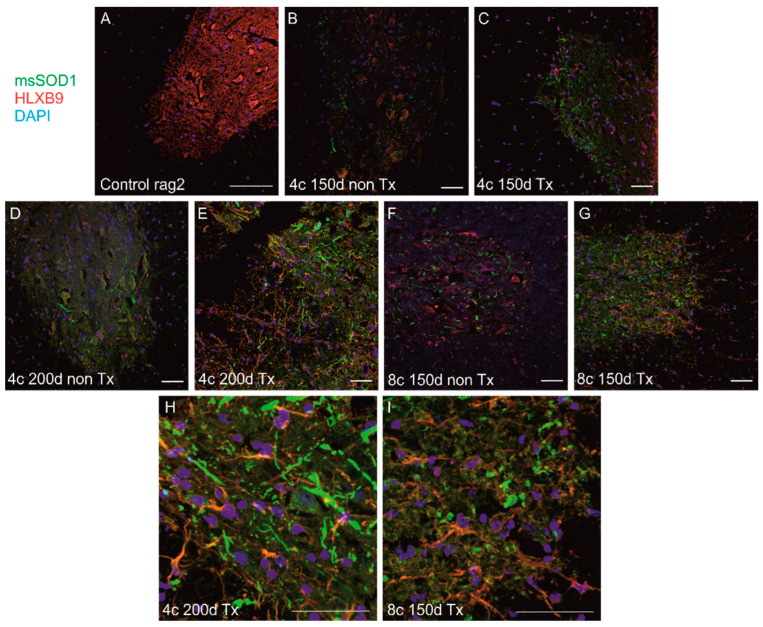
Figure 6.
Immunohistochemical analysis of spinal cords from mice transplanted with Q-Cells® and nontransplanted mice. There was no visible difference in spinal msSOD1 aggregation (green) was observed between: nontransplanted (B) and transplanted (C) 4-copy mice at 150 days; nontransplanted (D) and transplanted (E,H) 4-copy mice at 200 days; nontransplanted (F) and transplanted (G,I) 8-copy mice at 150 days. (H,I) represent cropped images of (E,G) respectively. Nontransplanted hSOD1(-) Rag2 mice spinal cord is shown as a control (A). HLXB9 was used for neuronal staining (red) and nuclei were counterstained with DAPI (blue). Scale 100 µm. Sample size within the Rag2 control group: n = 3; SOD1/rag2 nontransplanted 4-copy group at 150 days: n = 7; SOD1/rag2 transplanted 4-copy group at 150 days: n = 5; SOD1/rag2 nontransplanted 4-copy group at 200 days: n = 3; SOD1/rag2 transplanted 4-copy group at 200 days: n = 6; SOD1/rag2 nontransplanted 4-copy terminal group: n = 5; SOD1/rag2 nontransplanted 8-copy terminal group: n = 4; SOD1/rag2 transplanted 8-copy terminal group: n = 4.

