Figure 7.
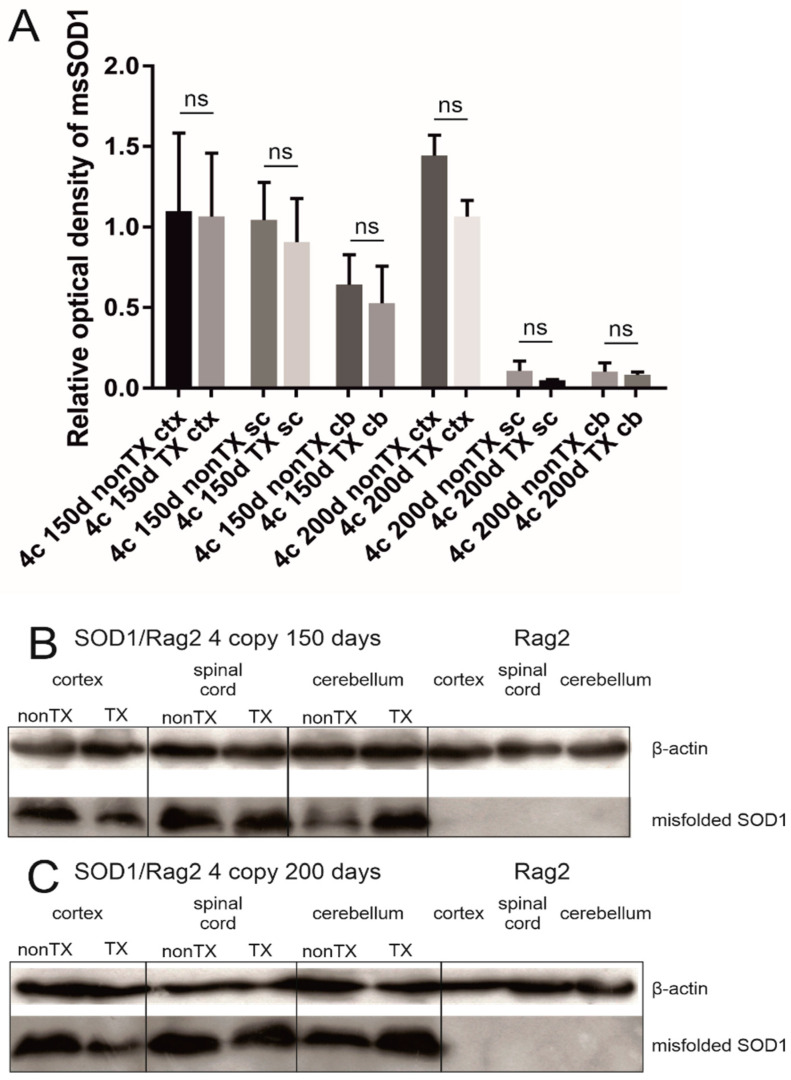
Western blot analysis revealed that there is no significant difference (ns) in the level of expression of misfolded SOD1 between transplanted (TX) and nontransplanted (nonTX) 4-copy hSOD1 animals (150 and 200 days old). Cortices (ctx), spinal cords (sc), and cerebella (cb) were analyzed separately. Rag2 mice are shown as a reference. Results were normalized to actin. The relative optical density of misfolded SOD1 in analyzed tissues (A). One-way ANOVA and Sidak’s tests were used with p < 0.05 considered statistically significant. Values are presented as mean ± SD. Representative blot from the 150 days mice group (B). Representative blot from the 200 days mice group (C). Sample size within the Rag2 control group: n = 5; SOD1/rag2 nontransplanted 4-copy group at 150 days: n = 5; SOD1/rag2 transplanted 4-copy group at 150 days: n = 5; SOD1/rag2 nontransplanted 4-copy group at 200 days: n = 5; SOD1/rag2 transplanted 4-copy group at 200 days: n = 5.

