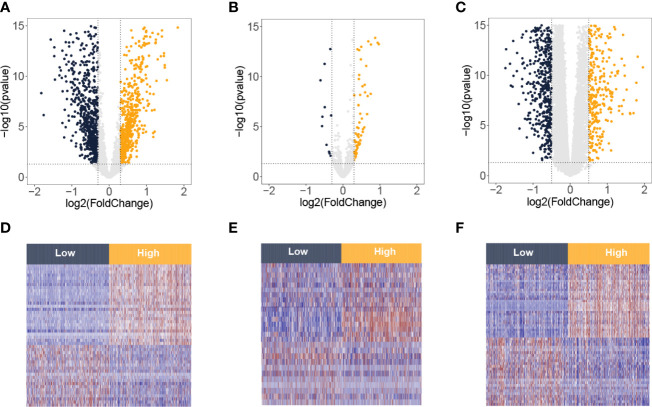
Figure 2.
Differentially expressed lncRNA, miRNA, and mRNA between low and high T-cell groups from the TCGA-BRCA database. Volcano plots of differentially expressed lncRNAs (A), miRNAs (B), and mRNAs (C). The red spots on the graphs reflect significantly elevated RNAs, whereas the green ones show significantly downregulated RNAs in the high T-cell group. Heatmaps of differentially expressed lncRNAs (D), miRNAs (E), and mRNAs (F). The red signifies increased expression, whereas the blue signifies decreased expression.

