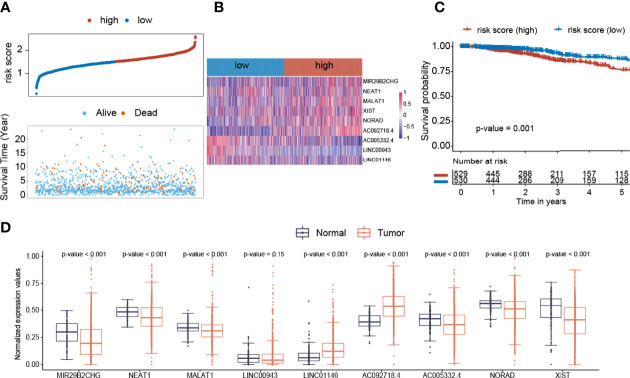
Figure 6.
Construction of the Cox regression model. (A) The distribution of prognosis including survival status and survival time between two risk score groups. (B) The heatmap of nine lncRNAs expression profiles. (C) The overall survival analysis of risk score groups. (D) The expression distribution values of nine lncRNAs between normal and breast cancer samples.

