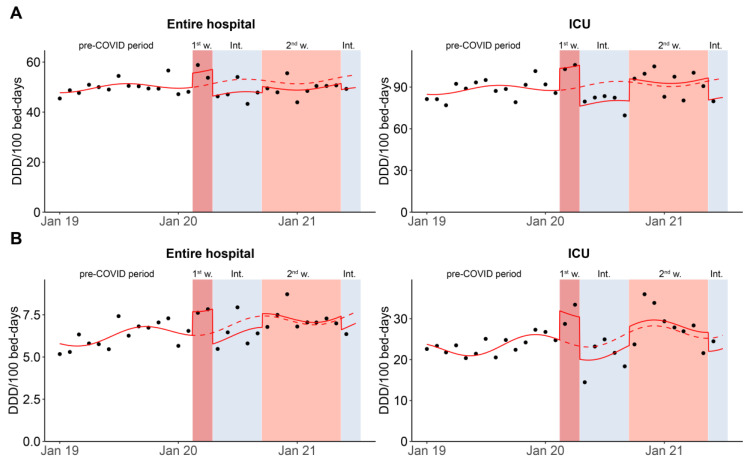
Figure 3.
Analysis of monthly antibiotic consumption using the ANRESIS subset, measured in DDD per 100 bed-days for (A) all antibiotics for systemic use (ATC code J01) and (B) broad-spectrum antibiotics only, for the entire hospital and ICUs between January 2019 and June 2021. The graph shows the impact of the two waves of the pandemic (reddish background) on antibiotic consumption, based on a segmented regression analysis. The solid line shows the estimates of the segmented regression model. The dotted line is the estimated regression model assuming that the pandemic had not occurred. The dots show the effective consumption per month. ICU, intensive care unit; 1st w, 1st wave; Int., intermediate periods; 2nd w, 2nd wave.

