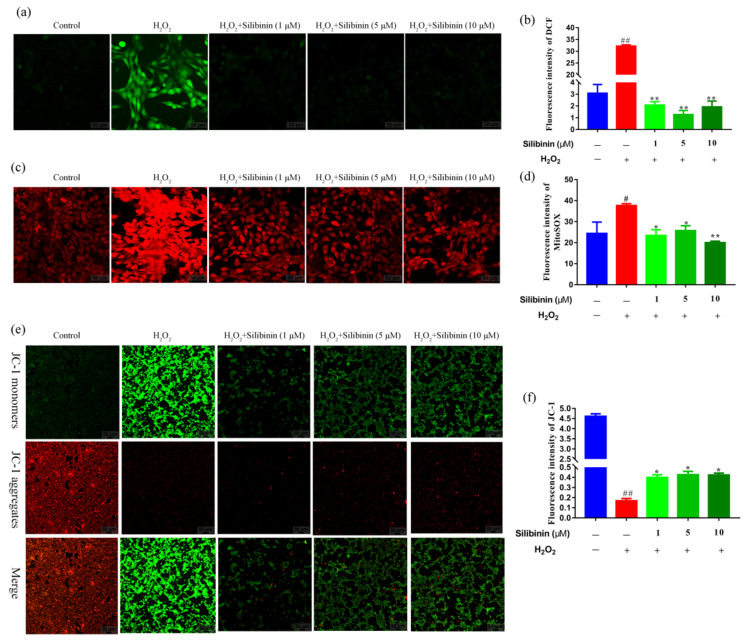
Figure 3.
The effects of silibinin on mitochondrial function in H2O2-exposed SH-SY5Y cells. SH-SY5Y cells were treated with different concentrations of silibinin in the presence of 750 μM H2O2 for 12 h. (a) Confocal images showing fluorescence signal of DCF, scale bar = 50 μm. (b) Quantitative analysis of fluorescent intensity in (a) by Image J. (c) Confocal images showing fluorescence signals of MitoSOX, scale bar = 50 μm. (d) Quantitative analysis of fluorescence intensity in (c) by Image J. (e) Confocal images showing fluorescence signals of JC-1, scale bar = 50 μm. (f) Quantitative analysis of fluorescence intensity in (e) by Image J. Data are expressed as mean ± SD of three independent experiments (n = 3). # p < 0.05 and ## p < 0.01, compared with the control group; * p < 0.05 and ** p < 0.01, compared with the H2O2-treated group.

