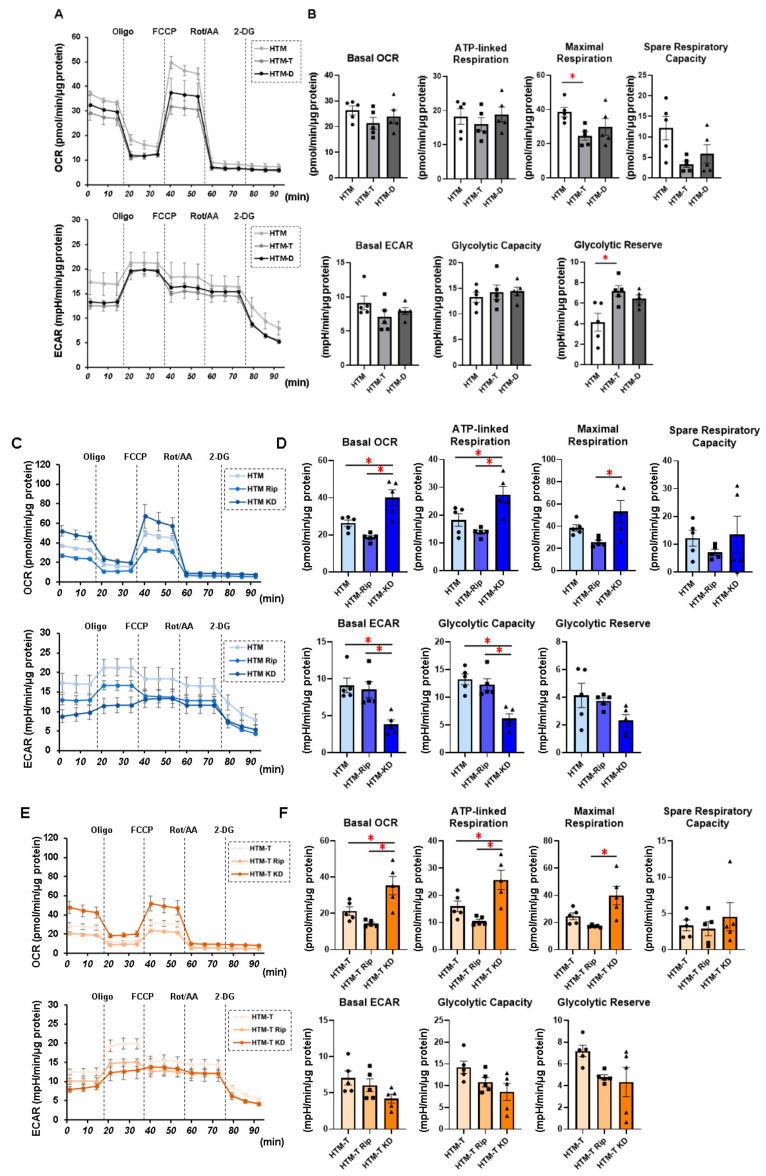
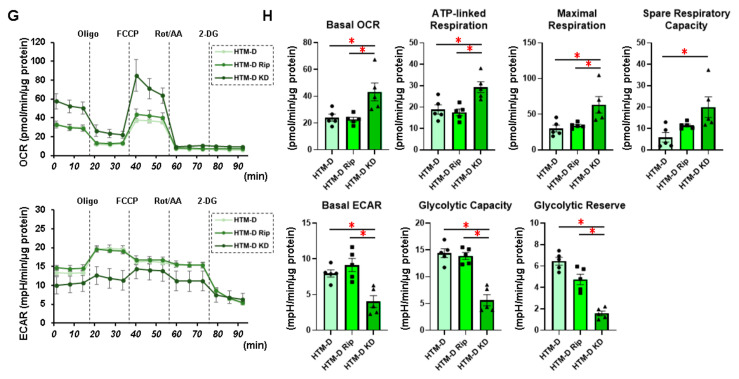
Figure 1.
Measurement of mitochondrial and glycolytic functions of TGF-β2- or DEX-treated or untreated 2D cultured HTM cells in the absence or presence of ROCK inhibitors (ROCK-is).Under the following four conditions: (1) 2D cultured HTM cells (HTM) and those treated with 5 ng/mL TGF-β2 (HTM-T) or 250 nM DEX (HTM-D), (2) untreated 2D cultured HTM cells treated without (HTM) or with 10 μM pan-ROCK-i ripasudil (HTM Rip) or ROCK2-i KD025 (HTM KD) for 24 h, (3) 5 ng/mL TGF-β2 (TGF)-treated 2D cultured HTM cells treated without (HTM-T) or with 10 μM pan-ROCK-i ripasudil (HTM-T Rip) or ROCK2-i KD025 (HTM-T KD) for 24 h, and (4) 250 nM DEX-treated 2D cultured HTM cells treated without (HTM-D) or with 10 μM pan-ROCK-i ripasudil (HTM-D Rip) or ROCK2-i KD025 (HTM-D KD) for 24 h, 2D cultured HTM cells were subjected to mitochondrial and glycolysis function analyses using a Seahorse XFe96 Bioanalyzer. Measurements of the oxygen consumption rate (OCR) and extracellular acidification rate (ECAR) before drug injections (at baseline) were calculated as 100%, and their changes were determined by the following injections: (i) oligomycin (a complex V inhibitor), (ii) FCCP (a protonophore), (iii) rotenone/antimycin (complex I/III inhibitors), and (iv) 2-DG (a hexokinase inhibitor). (A,C,E,G) Measurements of the OCR and ECAR. (B,D,F,H) Plots for subcomponents of OCR (basal, ATP-linked respiration, maximum respiration, and spare respiratory capacity) and ECAR (basal, glycolytic capacity, and glycolytic reserve). ATP-linked respiration was defined as the average OCR in the presence of oligomycin. Maximum respiration was defined as the average OCR in the presence of FCCP. Spare respiratory reserve was defined as the difference between the average OCR in the presence of FCCP and the average OCR at baseline. Glycolytic reserve was defined as the difference between the final measurement of the ECAR in the presence of oligomycin and the average ECAR. The data are presented as the means ± the standard error of the mean (SEM). Note: * p < 0.05 (Student’s t-test).


