Figure 5.
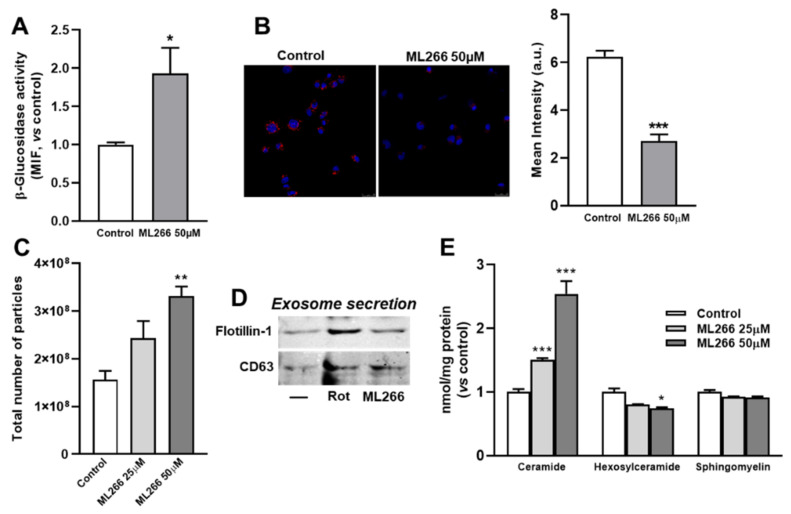
Effects of β-glucosidase activator on glioma C6 cells (A) β-glucosidase activity as analyzed by flow cytometry. Cells were incubated in LDL-supplemented medium with or without ML266 for 2 h, then the reaction substrate was added for 30 min and analyzed by flow cytometry. Results are the mean ± SEM of three independent experiments. The control is normalized to 1. MIF, median intensity of fluorescence. (B) C6 cells were exposed to DiI-LDL (20 μg/mL of cholesterol) and 2.5 μM U18666A for a total of 16 h and without (Control) or with ML266 (50 μM) for the last 4 h. The cells were fixed and analyzed by confocal microscopy. The images show DiI-LDL in red and nuclei labeled with Hoechst-33342 in blue. Representative results from three independent experiments are shown. Scale bars = 25 μm. The graph shows quantitative results of DiI-LDL labeling (mean intensity, a.u.) in cells of each photomicrograph. Results are the mean ± SEM of three independent experiments, with 8−10 photographs per experiment. (C) Total particle secretion analyzed by nanoparticle tracking. The experiments started with the same number of cells. Cells were exposed to LDL (60 µg/mL of cholesterol) in the presence of 2.5 µM U18666A for 12 h. The medium was then removed, the cells washed twice, and serum-free medium was added, supplemented with U18666A, then incubation was continued for 4 h in the presence of 50 μM ML266 or 5 μM rottlerin (Rot). At the end of the incubation, the medium was removed, and the exosomes/microvesicles were isolated and analyzed. The mean ± SEM of three measures are shown. (D) Western blot of flotillin-1 and CD63 in secreted particles. Results are representative of three independent experiments. (E) Sphingolipids cell contents. Cells were incubated without (Control) or with 50 μM ML266 for 4 h. Ceramides, hexosylceramides, and sphingomyelin were measured by mass spectrometry as described in Methods. Results are the mean ± SEM of three independent experiments. The control is normalized to 1. Statistical comparisons shown are treatment versus control (* p < 0.05, ** p < 0.01, *** p < 0.001).

