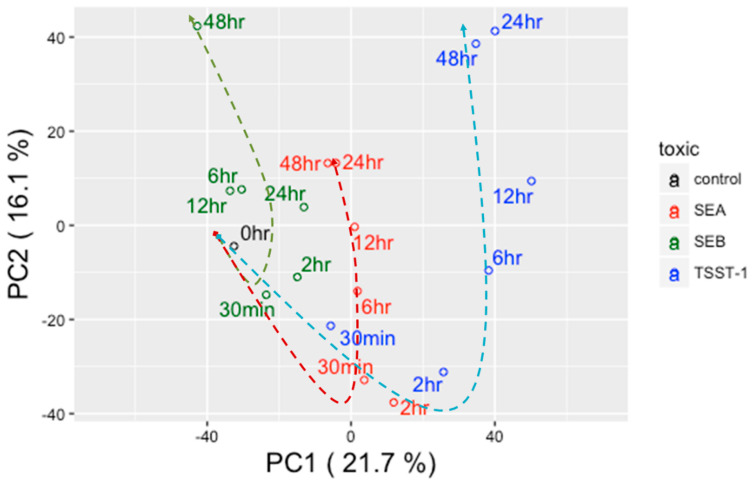
Figure 1.
Principal components analysis (PCA) of time-resolved gene expression values. Black-, red-, green-, and blue-colored open circles represent control, SEA, SEB, and TSST-1, respectively. Dotted lines trace the temporal shifts caused by different toxins; here red, green, and blue dotted lines represent control, SEA, SEB, and TSST-1, respectively.

