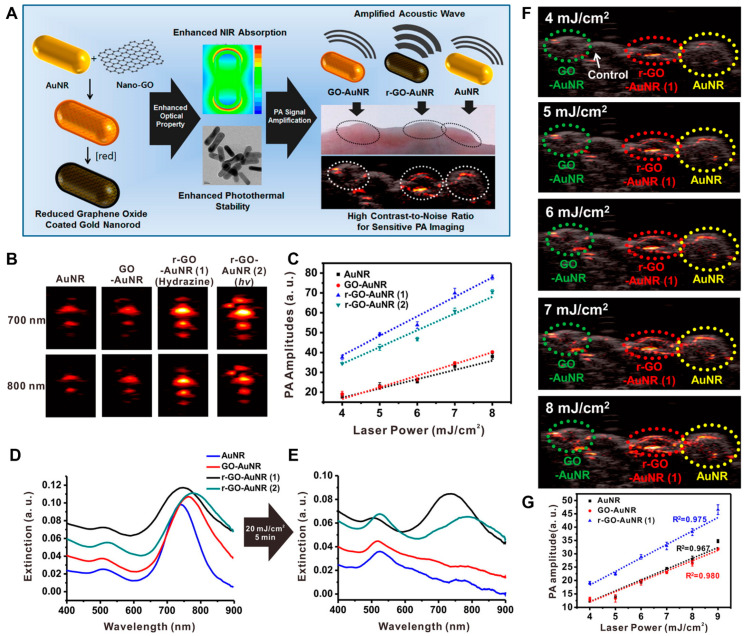
Figure 5.
rGO–AuNRs for PAI application. (A) Synthesis and characterization of rGO–AuNRs and in vivo mouse PAI. (B) Representative PA images obtained at 700 and 800 nm laser irradiation and (C) corresponding PA amplitude. UV–visible spectra (D) before and (E) after laser illumination for 5 min (20 mJ/cm2, 10 Hz). (F) PA images visualized after illumination with different input laser powers that ranged from 4 to 8 mJ/cm2 in living mice. (G) Quantitative analysis of photoacoustic signal intensities obtained with each group. The images are reproduced with permission from ref. [103].

