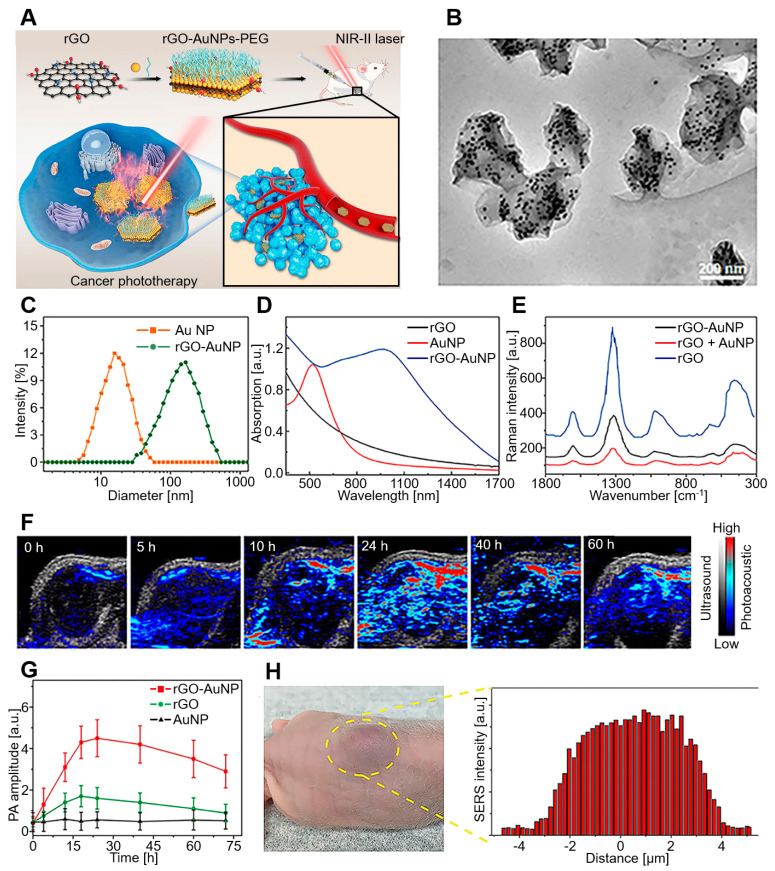
Figure 6.
rGO–AuNP–PEG for PAI in the NIR-II window. (A) Schematic diagram of rGO–AuNP–PEG synthesis and PAI-guided PTT for cancer ablation in the NIR-II window. (B) TEM images, (C) hydrodynamic distribution, (D) UV–vis spectra, and (E) SERS spectra of rGO–AuNPs. (F) PA images and (G) PA amplitude after 1250 nm laser irradiation. (H) In vivo SERS signal of the tumor and its surrounding tissues to determine the boundary between tumor and normal tissue. The images are reproduced with permission from ref. [105].

