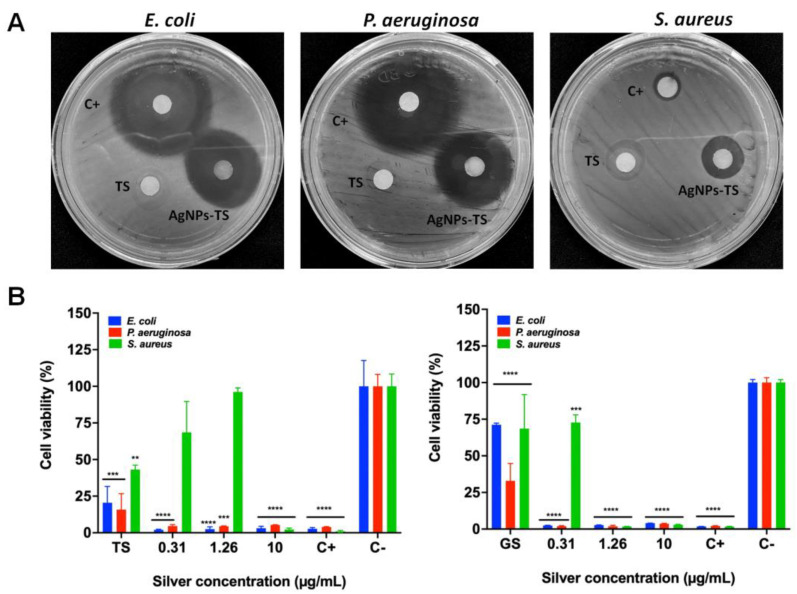
Figure 7.
Representative images of bacterial inhibition strains with biosynthesized AgNPs (A) and cell viability of bacteria (B) after exposed to AgNPs for 24 h. Results are expressed as the mean ± SD (n = 3) ** p < 0.01; *** p < 0.001; **** p > 0.0001 using two-way ANOVA with a Dunnett’s multiple comparisons tests.

