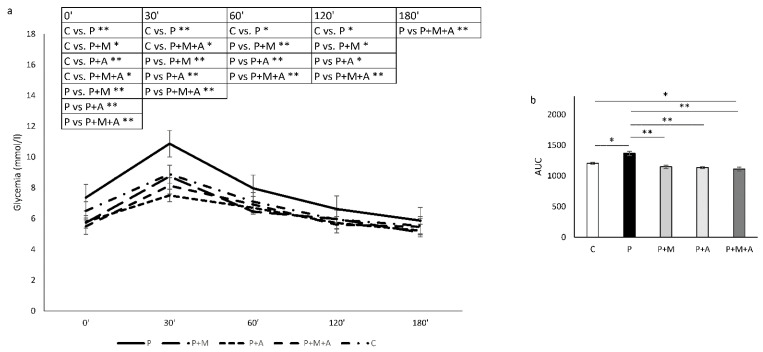
Figure 4.
Results of oral glucose tolerance test in rats. (a) Glucose concentration in plasma at 0, 30, 60, 120, and 180 min. (b) Area under the curve (AUC). Data are presented as mean ± SEM. * Statistical significance at the level of p < 0.05 between groups, ** Statistical significance at the level of p < 0.01 between groups (6 rats per group).

