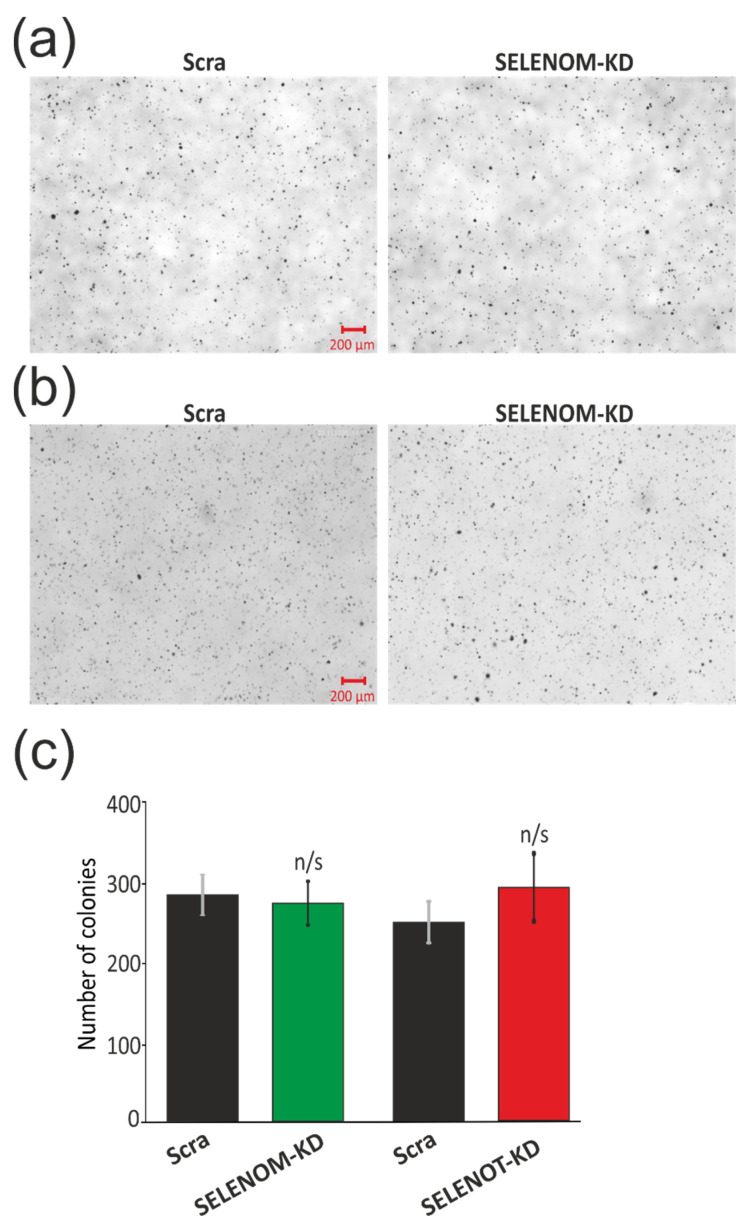
Figure 3.
Effects of SELENOM-KD and SELENOT-KD on anchorage-independent colony formation in soft agar. Representative soft agar dishes with stained colonies for Control (Scra), SELENOM-KD (a), and SELENOT-KD (b). Quantification of grown colonies in A-172 cells with SELENOM-KD or SELENOT-KD and in control cells (Scra) (c). Three independent replications of this series of experiments were carried out. Comparison of KD groups vs. Scra: n/s—data not significant (p > 0.05).

