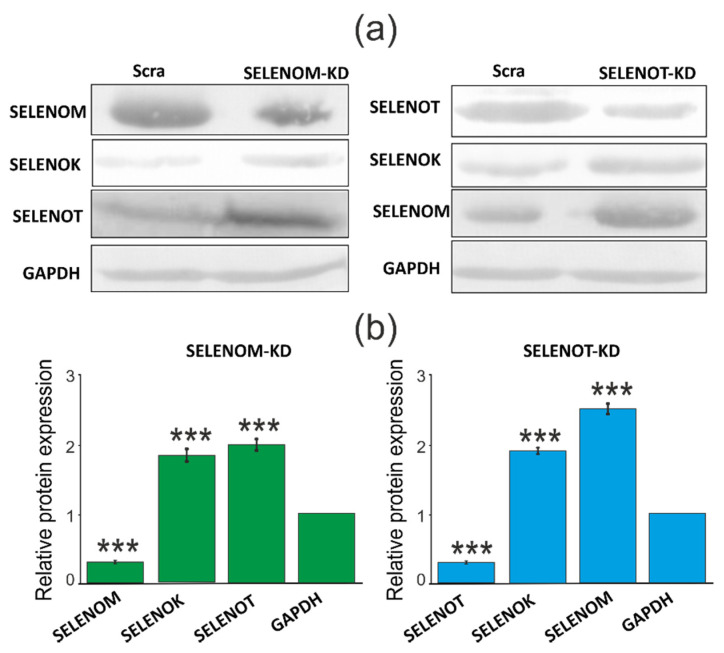
Figure 7.
Comparative analysis of the quantitative content of ER resident selenoproteins in samples with SELENOM-KD or SELENOT-KD and control samples, performed using Western blotting (a). Quantification of the content of ER resident selenoproteins in A-172 cells transduced with constructs SELENOM-KD (or SELENOT-KD) and scrambled RNA (Scra) (b). Comparison of experimental groups regarding GAPDH level: *** p < 0.001.

