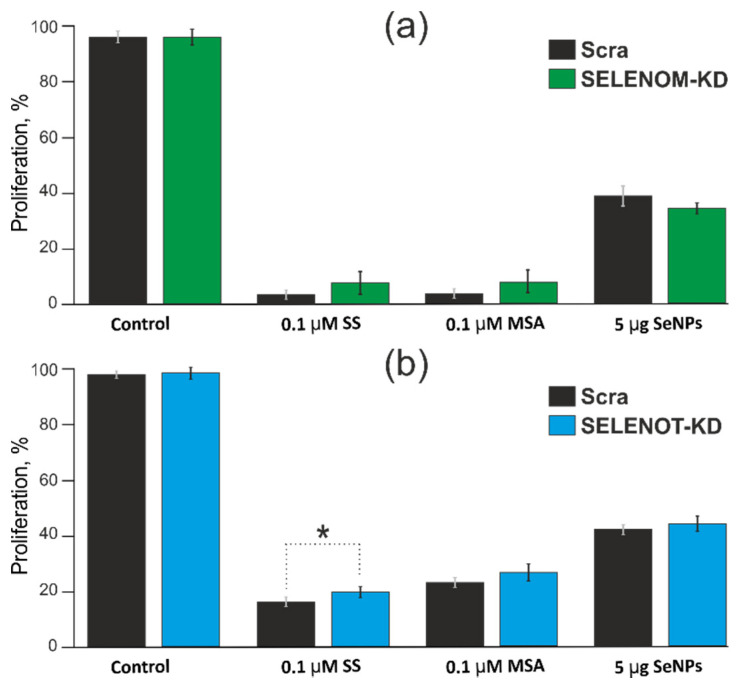
Figure 8.
Comparison proliferation assay performed by MTT. Analysis the proliferation of A–172 cells before and after SELENOM-KD (a) or SELENOT-KD (b) after treatment with 0.1 µM SS, 0.1 µM MSA and 5 μg/mL SeNP 24 h. The optical density at 590 nm was measured, and the values of the respective untreated cells were defined as 100%. Standard deviations were determined by analysis of data from at least three independent experiments and are indicated by error bars. * p < 0.05.

