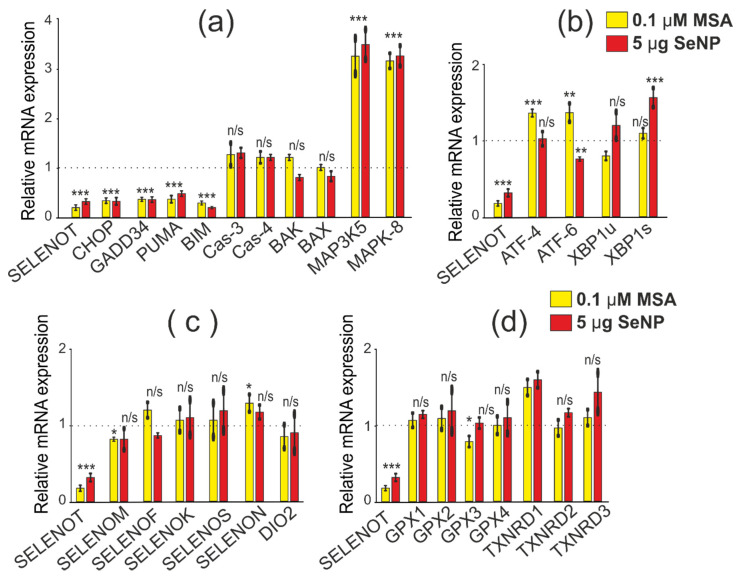
Figure 11.
Comparative analysis of mRNA expression patterns of various genes under SELENOT-KD and after 24 h treatment of A-172 cells with 0.1 µM MSA and 5 µg/mL SeNP, obtained using real-time PCR. (a) mRNA expression of pro-apoptotic genes; (b) mRNA expression of three UPR signaling pathways markers; (c) mRNA expression of ER resident selenoproteins; (d) mRNA expression of selenium-containing glutathione peroxida44ses and thioredoxin reductases. Comparison of experimental groups regarding control, indicated as dash line (1): n/s—data not significant (p > 0.05), * p < 0.05, ** p < 0.01, and *** p < 0.001.

