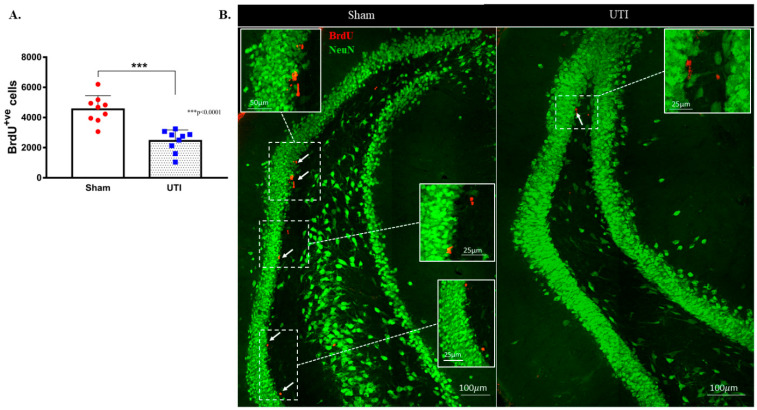
Figure 4.
Decrease in the proliferation of DG NSCs on day 4 post infection. (A) Stereological quantification of BrdU-labeled cells in the DG of the sham group (n = 9) and rats with a UTI (n = 9) sacrificed on day 4 post infection. Unpaired Student’s t-test was used to determine the statistical significance between the sham (n = 9) and UTI (n = 9) groups. Each bar represents the average ± SEM of BrdU-positive cells per group and each dot represents the measured number in each rat. This method of presentation was followed for all subsequent figures. (B) Representative confocal images showing immunofluorescence labeling of NeuN (green) and BrdU (red; arrows) in the DG of the sham group and rats with a UTI. Images were taken as Z stacks and tile scan using a 40×-oil objective.

