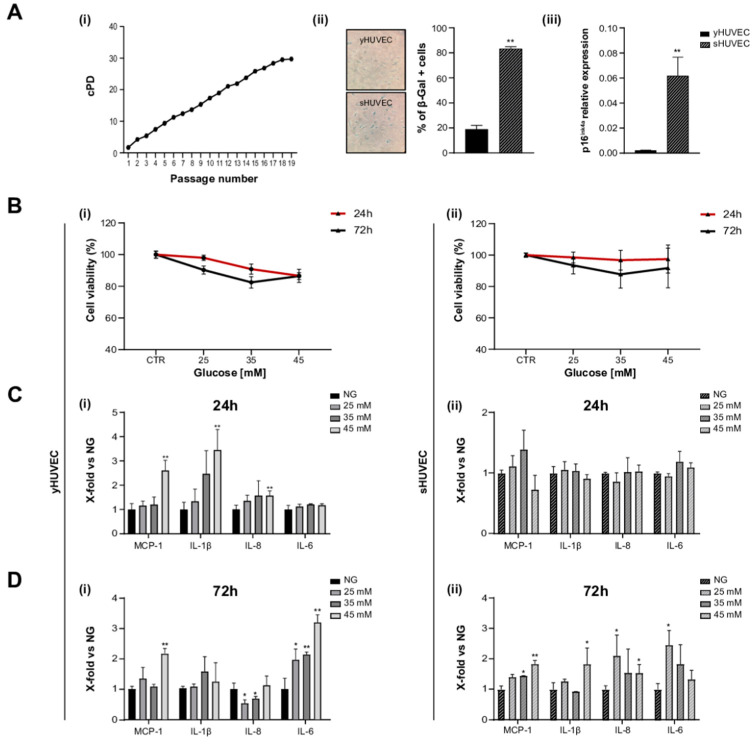
Figure 1.
High glucose concentration induced inflammation in yHUVEC and sHUVEC. Characterization of sHUVEC by a cumulative population doubling curve (i), β-Gal activity (ii) and p16ink4a expression level (iii) (A). Effect of high-glucose treatments on cell viability. yHUVEC (i, left-hand side panel) and sHUVEC (ii, right-hand side panel) cells were treated with 25, 35 and 45 mM glucose for 24 and 72 h. Cell viability was determined by the MTT assay (B). Relative mRNA expression of MCP-1, IL-1β, IL-8 and IL-6 in yHUVEC (i, left-hand side panel) and sHUVEC (ii, right-hand side panel) in cells upon treatment with 25, 35 and 45 mM of glucose for 24 h (C) and 72 h (D). Results are expressed as mean ± SD of three independent biological replicates. Asterisks (*) indicate significance versus NG; * p < 0.05, ** p < 0.01. NG, normal glucose; HG, high glucose.

