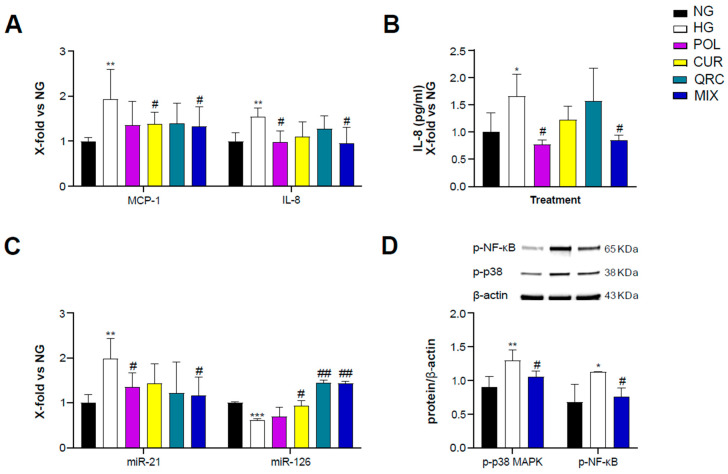
Figure 3.
Effect of each compound following exposure to high glucose in yHUVEC. The cells were treated for 24 h with a single compound or with their combination. Relative mRNA expression of MCP-1 and IL-8 (A), concentration (pg/mL) of IL-8 in the culture medium (B), expression levels of miR-21 and miR-126 (C), representative western blot analysis showing p-p38 MAPK and p-NF-kB expression in yHUVEC treated with NG, HG or the MIX (D). β -actin levels were used as a control. The bands were quantified by ImageJ. All data are reported as fold change vs. untreated young HUVEC. The results are expressed as mean ±SD from three independent biological replicates. In all panels, asterisks (*) indicate significance versus NG; (#) indicates significance versus HG; one symbol, p < 0.05; two symbols, p < 0.01; three symbols, p < 0.001. NG, normal glucose; HG, high glucose; POL, polydatin; CUR, curcumin; QRC, quercetin; p-p38, phosphorylated-p38; p-NF-kB, phosphorylated-NF-kB; β -act, β -actin.

