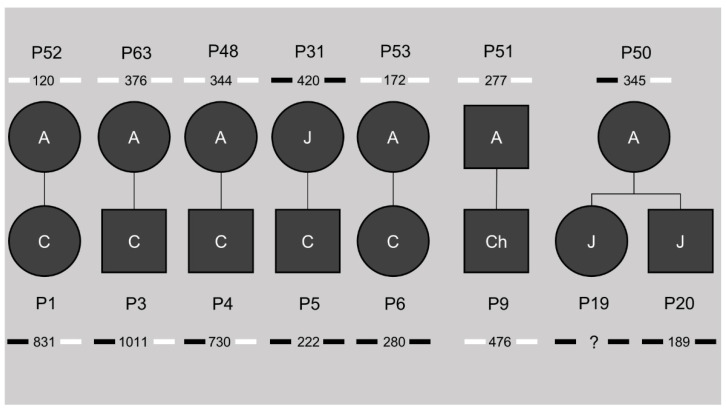
Figure 2.
Pedigrees of the known families in our study cohort. The number beneath the patient identification code indicates the ePAL (estimated progenitor allele size), with the bars next to it indicating methylation status of CTCF1 (left) and CTCF2 (right). Black indicates methylation, white no methylation. A = adult, J = juvenile, Ch = childhood, C = congenital. ? = unknown CTG expansion size.

