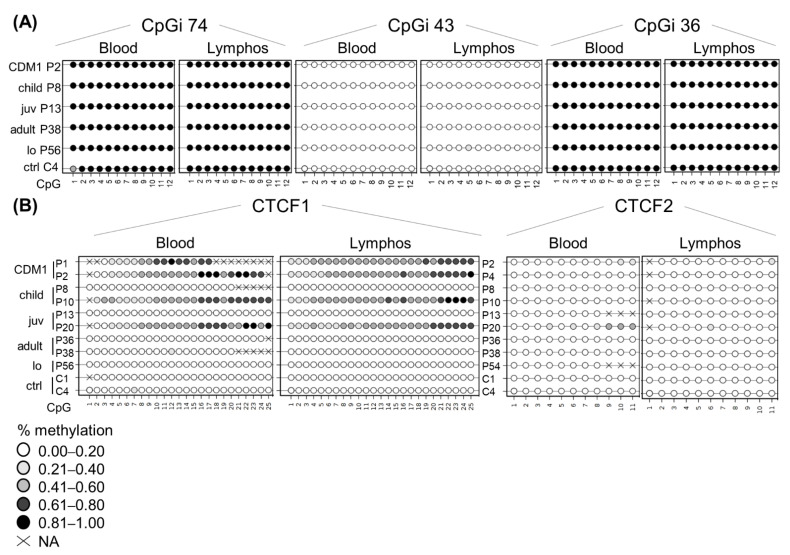
Figure 3.
DNA methylation profile is preserved at the DMPK locus in patient-derived lymphoblastoids. Comparison of the DNA methylation profile between blood and lymphoblastoid cell lines of the same individual across the five annotated CpG regions: (A) CpGi 74, 43 and 36. (B) CTCF1 and CTCF2. Each circle represents a CpG dinucleotide. The colour gradient represents the level of methylation indicated in the legend assessed by sodium bisulphite sequencing. Abbreviations: C = control, P = DM1 patient; CDM1 = congenital, child = childhood, juv = juvenile, lo = late-onset, ctrl = controls, lymphos = lymphoblastoids.

