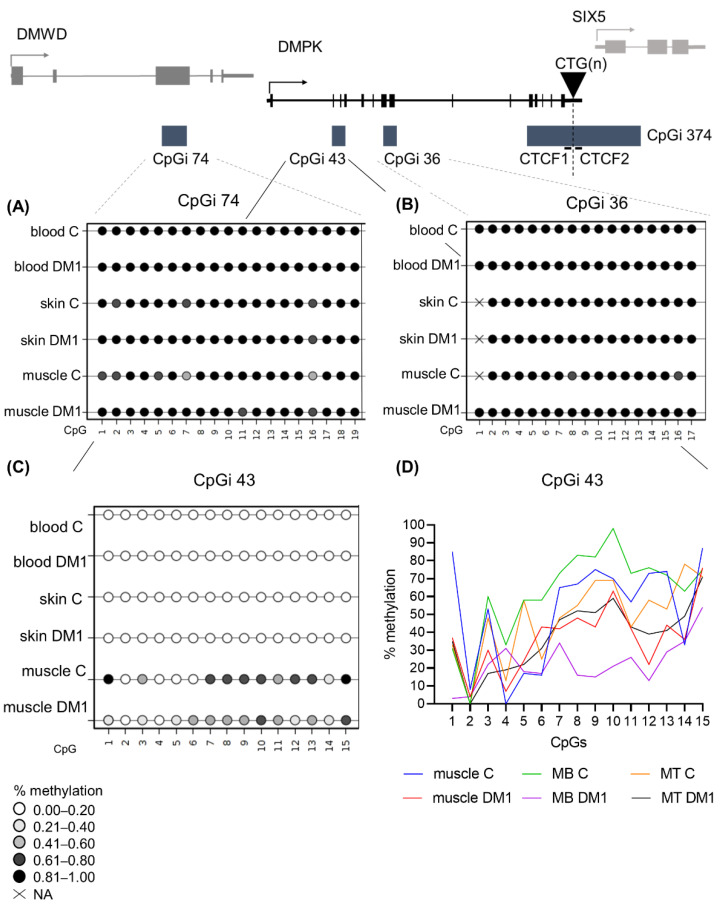
Figure 4.
DNA methylation profile at CpGi 43 showed specific hypomethylation in DM1 muscle tissue and muscle-derived cells. (A–C) Averages of DNA methylation profiles across the three studied tissues, blood, skin and muscle, in patients versus controls for CpGi 74 (A), for CpGi 36 (B) and CpGi 43 (C). Included patients are from the juvenile, adult and late onset clinical category (n = 5 for blood, n = 3 for skin, n = 7 for muscle and n = 4 for controls). Each circle represents a CpG dinucleotide. The colour gradient represents the level of methylation indicated in the legend assessed by sodium bisulphite sequencing. (D) Representation of the DNA methylation profiles of muscle and muscle-derived cells (myoblasts and myotubes) in CpGi 43 assessed by bisulphite sequencing.

