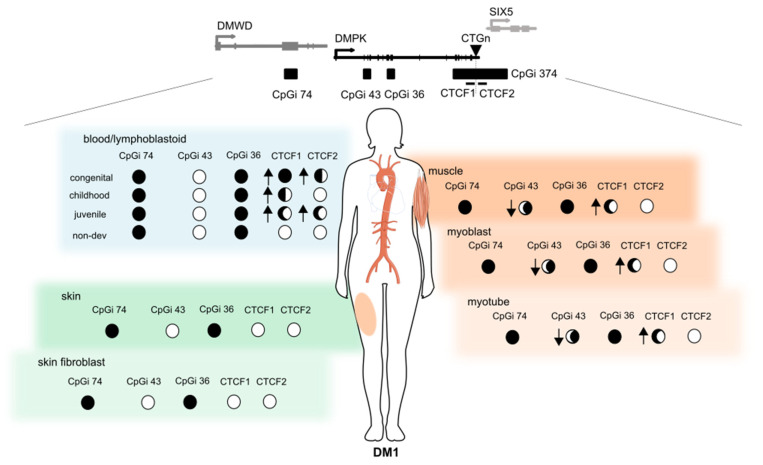
Figure 6.
Summary of the epigenetic landscape of the DMPK locus in DM1. An overview is given of the methylation status across the DMPK locus in muscle, skin and blood and their derived cells in DM1 patients. The circle underneath each CpG island represents its methylation status, ranging from fully methylated (black) to completely unmethylated (white) in DM1 patients. The arrows indicate the changes compared to controls, where an upward arrow means increased methylation in DM1 compared to controls. This figure was partially made using Servier Medical Art (smart.servier.com, accessed on 31 March 2022).

