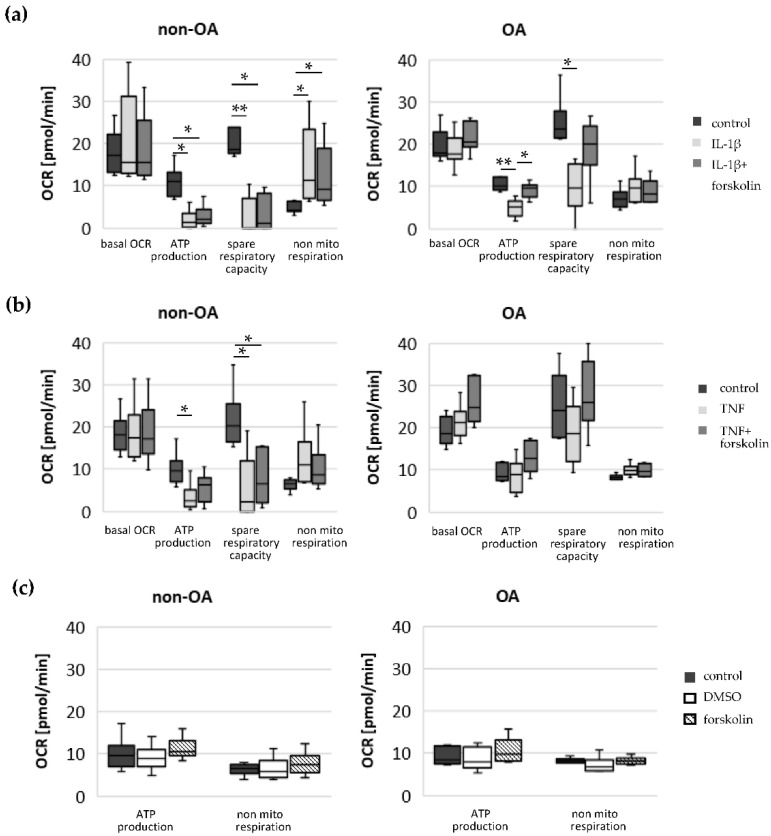
Figure 3.
Changes in basal oxygen consumption rate, mitochondrial ATP production, spare respiratory capacity and non-mitochondrial respiration of non-OA and OA chondrocytes before and after stimulation with (a) IL-1β and forskolin (non-OA patients = 6, OA patients = 7), (b) TNF and forskolin (non-OA patients = 6, OA patients = 6) and (c) forskolin and DMSO (non-OA patients = 6, OA patients = 6). Values are displayed as box plots. Statistics: Kruskal–Wallis test followed by Mann–Whitney U test and Bonferroni correction. ** p < 0.01 and * p < 0.05. Control: unstimulated cells; DMSO: dimethyl sulfoxide; OCR: oxygen consumption rate; mito: mitochondrial.

