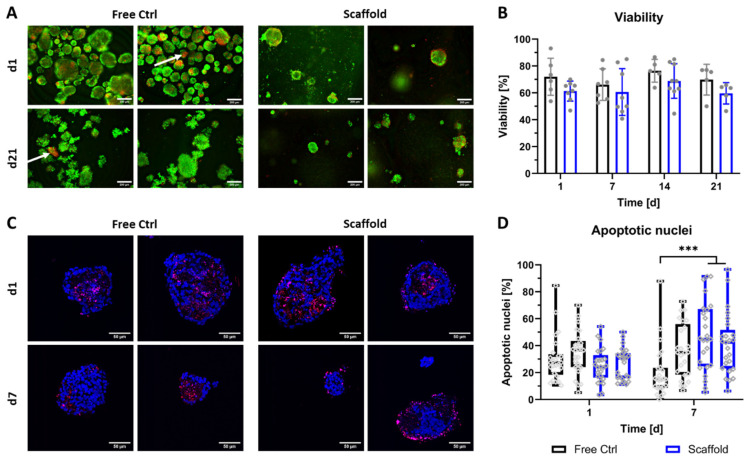
Figure 2.
Viability of bioprinted NICC. (A) Live/dead staining of free control and bioprinted (“Scaffold”) NICC, representative images taken on d1 and d21 after printing, scale bars = 200 µm. White arrows indicate single islets with a majority of dead cells; (B) Semi-quantitative assessment of islet viability on the basis of live/dead stainings as shown in A. Mean ± SD, n ≥ 5, >25 NICC each. Repeat experiments are depicted as grey dots. Due to a limited number of samples, not all time points and conditions were analysed in all repeat experiments, which resulted in an n = 5–7 for free control, and an n = 5–9 for bioprinted scaffolds; (C) TUNEL staining for apoptotic nuclei in free control and bioprinted (“Scaffold”) NICC, representative images of samples fixed on d1 and d7 after printing, scale bars = 50 µm; (D) Quantitative analysis of percent apoptotic nuclei per islet. Mean ± SD, n = 2, 25 NICC each, *** p < 0.001. Repeat experiments depicted as neighbouring box plots, grey dots indicate individual islets.

