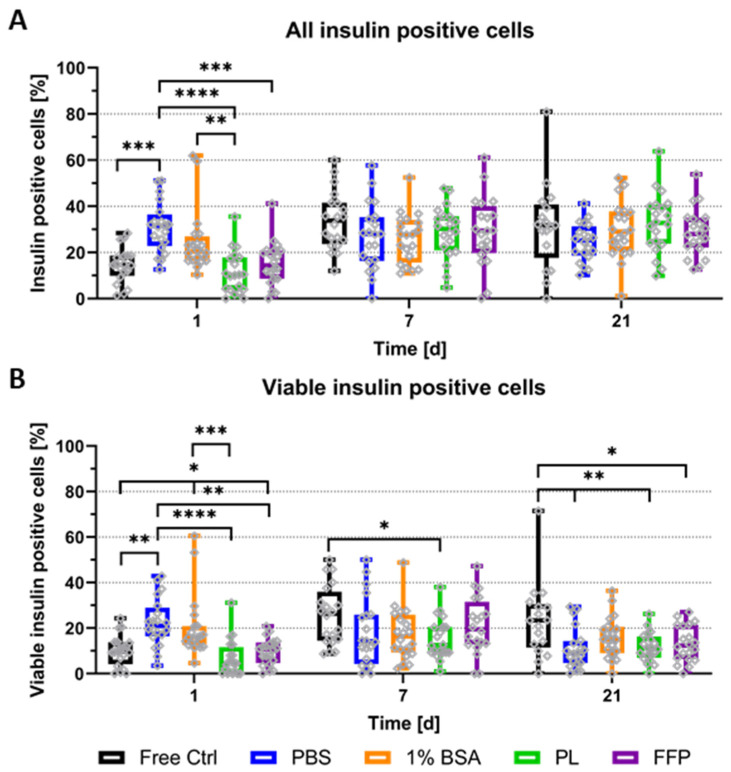
Figure 5.
Quantitative analysis of insulin-producing cells in NICC. Analysed groups are free control NICC in suspension culture and NICC bioprinted in PBS-algMC, BSA-algMC, PL-algMC, and FFP-algMC. (A) Percent insulin-positive of all cells per islet cluster, including double-positive cells for insulin and TUNEL; (B) Percent viable insulin-positive of all cells per islet cluster, excluding double-positive cells for insulin and TUNEL. Mean ± SD, n = 1, 20 NICC. Grey dots in all graphs indicate individual islets, significances indicate * p < 0.05, ** p < 0.01, *** p < 0.001, **** p < 0.0001.

