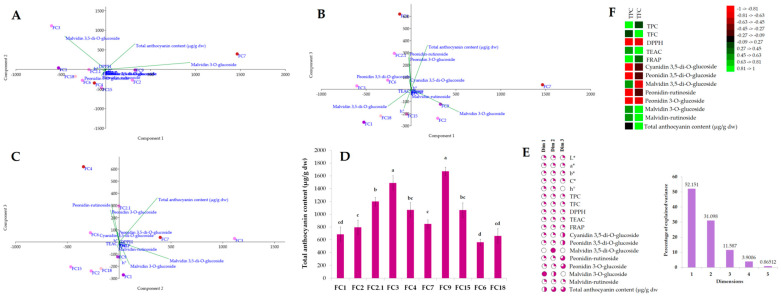
Figure 7.
Exploratory multivariate analysis using PCA (A–C) with samples distribution into PC1 and PC2, PC1 and PC3, and PC2 and PC3, respectively; (D) Total anthocyanins content of Cyclamen genotypes flowers; (E) Explained variance by each components and contribution of color measurements, antioxidant activities, and anthocyanin profiles to the principal components; (F) Pearson’s correlation between total phenolic and flavonoid content, antioxidant activities, and anthocyanin profiles.

