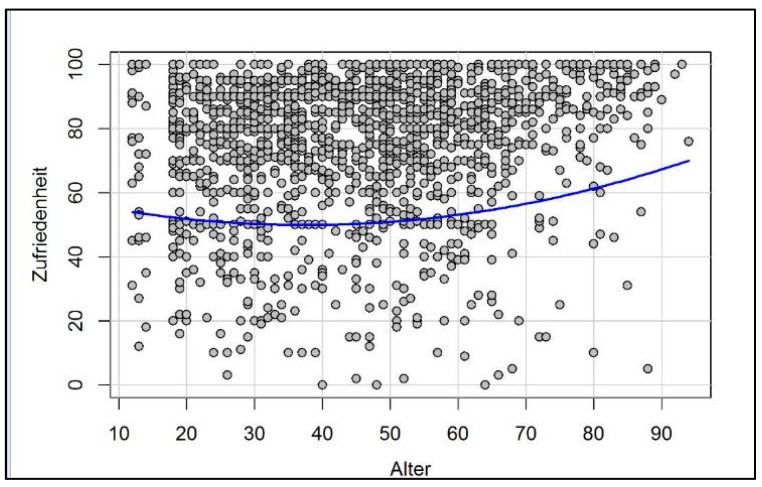
Figure 2.
U-Curve of Happiness. Unpublished raw data from our Experience of Salience and Happiness (ESH) database depicting a flat U-curve correlation between happiness/life satisfaction (“Zufriedenheit”) and age (“Alter”); cross-sectional correlation analysis: empirical evaluation based on data from 1597 individuals aged 12 to 94 in Germany (for further information, see [9,10]).

