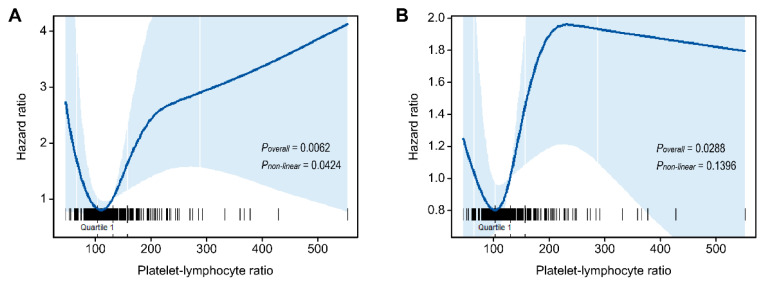
Figure 4.
Hazard ratio for the risk of disease-specific death (A) and progression (B) in oral squamous cell carcinoma patients, evaluated by restricted cubic splines from unadjusted Cox proportional hazard models. The solid line represents the central risk estimate, and the shaded area represents the 95% confidence interval. The rug plot is of cases.

