Figure 10.
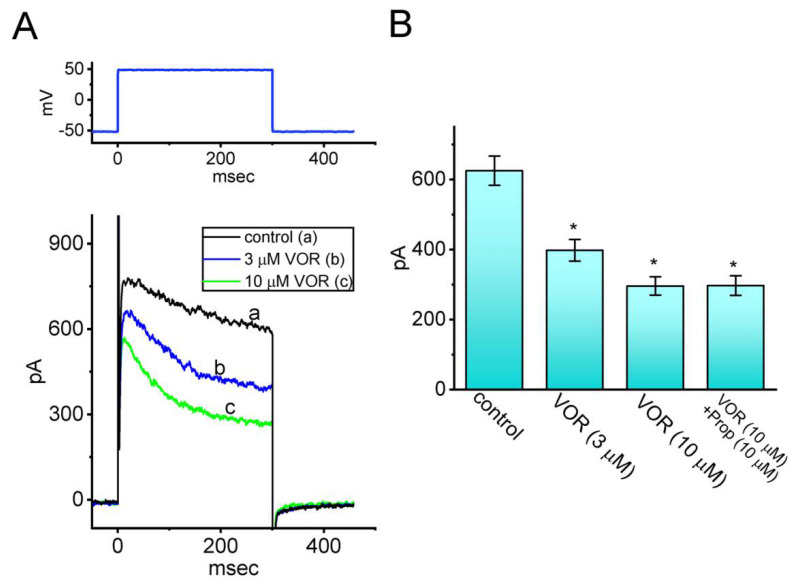
Inhibitory effect of VOR on IK(DR) identified from Neuro-2a cells. In these experiments, cells were bathed in Ca2+-free Tyrode’s solution containing 1 μM TTX and 0.5 mM CdCl2. (A) Representative current trace obtained in the control period (a, i.e., absence of VOR) and during cell exposure to 3 μM VOR (b) or 10 μM VOR (c). The upper part shows the voltage protocol used. (B) Summary bar graph demonstrating effect of VOR and VOR plus propranolol (Prop) on the amplitude of IK(DR) (mean ± SEM, n = 7 for each bar). Current amplitude was measured at the end of 300-ms depolarizing pulse from −50 to +50 mV. * Significantly different from control (p < 0.05).

