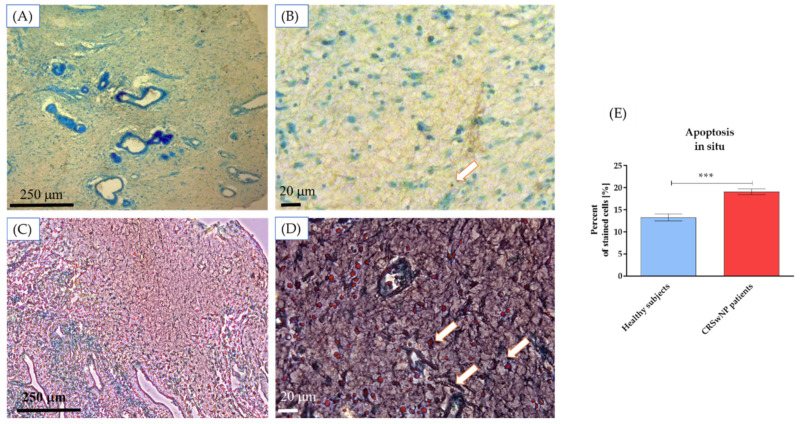
Figure 1.
Apoptosis detection in tissue sections derived from healthy subjects (A,B) and CRSwNP patients (C,D). The statistical analysis was performed on representative images (healthy subjects n = 5 and CRNwNP n = 5). Scale bars, 250 and 20 µm are indicated in the microphotographs. The white arrows indicate apoptotic nuclei. The statistical analysis results show significantly increased apoptotic cells in tissues of CRSwNP patients (E). Statistically significant differences were noted at p < 0.001 (***).

