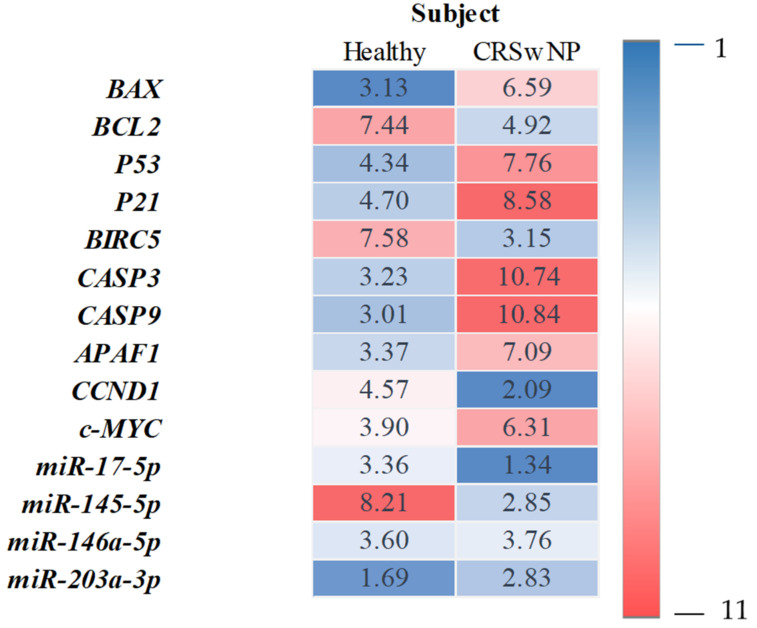
Figure 4.
Summary of the obtained transcripts expression profiles. Heatmap showing the examined mRNA and miRNA levels in the healthy subjects (n = 10) and CRSwNP patients (n = 10). Each RT-qPCR was done with at least three technical repetitions. The heatmap shows the mean relative transcript amount obtained for healthy subjects and CRSwNP. Levels of down expression (blue) or overexpression (red) are shown on a log2 scale from the high to the low expression of each gene.

