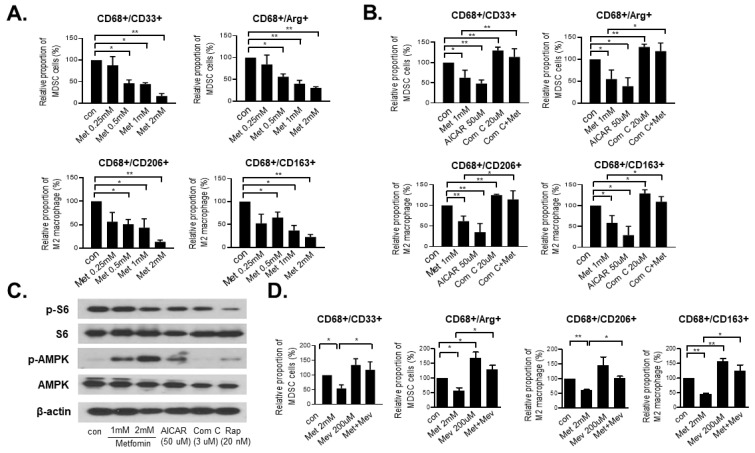
Figure 1.
Metformin, an AMPK regulator, and mevalonate modulate the fractions of MDSCs and M1/M2 macrophages. (A) THP-1 cells were treated with 0.25 to 2 mM metformin in a dose-dependent manner for 48 h., and (B) THP-1 cells were treated with 1 mM metformin, 50 μM AICAR, 20 μM Comp C and a combination of Comp C and metformin for 48 h. Next, flow cytometry analyses were performed using the markers of MDSCs (CD68+ CD33+ and CD68+ Arg-1+), and M2 macrophages (CD68+ CD206+ and CD68+ CD163+). Data are expressed as the means ± standard errors of the four different experiments; * p < 0.05, ** p < 0.005. (C) In Western blot analysis, the expressions of phosphorylated S6 and phosphorylated AMPK were analyzed after 48 h of treatment with the control vehicle or 1 mM and 2 mM metformin, 50 μM AICAR, 3 μM Comp C and 20 nM rapamycin in THP-1 cells. (D) THP-1 cells were treated with 2 mM metformin with or without 200 μM mevalonate. Next, the expression levels of MDSC (CD33+/CD68+ and Arg-1+/CD68+) and M2 macrophages (CD206+/CD68+ and CD163+/CD68+) markers were analyzed by flow cytometry. Data are expressed as means ± standard errors of the three different experiments; * p < 0.05, ** p < 0.005.

