Figure 5.
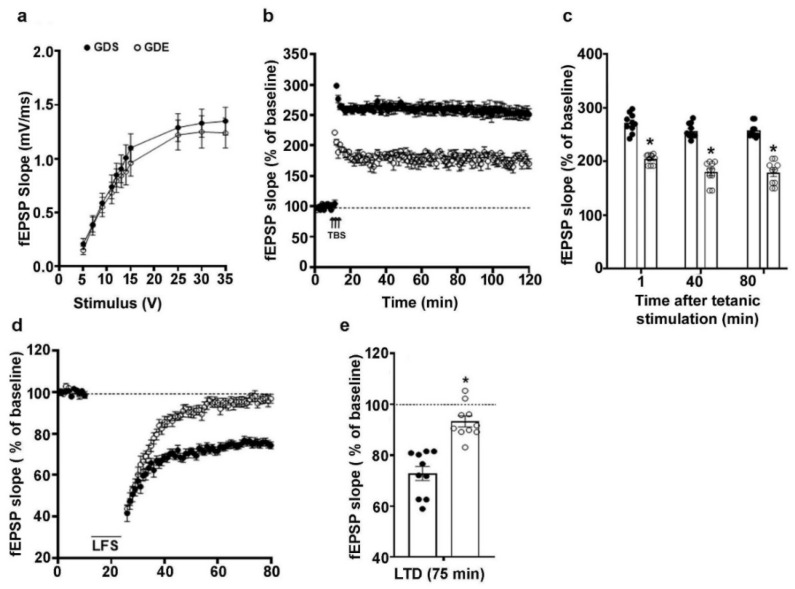
GDE-caused LTP and LTD impairments in adult mice. Input/output relationship plots of HP slices from GDS and GDE mice (a). The average field excitatory postsynaptic potentials (fEPSP) slope at various time points obtained from GDS and GDE adult male mice (b). For each slice, the fEPSP slopes were normalized against the average slope over the 10 min recording period before LTP induction. The arrows show the time of theta burst stimulation (TBS) (4 pulses at 100 Hz; the bursts repeated at 5 Hz, and each tetanus included three different 10-burst trains separated by 15 s). The bar graph indicates the average fEPSP slopes at multiple time points after TBS for the GDS and GDE groups (c). The average fEPSP slope at various time points obtained from GDS and GDE adult male mice after LTD induced by low-frequency stimulation (LFS) (d). The fEPSP slopes were normalized to the average value 10 min before LFS stimulation. A bar graph indicates a combined plot of the averages of fEPSP slopes at 75 min and shows the absence of LTD induced by LFS in GDE mice compared with GDS mice (e). Error bars, SEM (* p < 0.05 vs. GDS group; n = 5 mice/group; 10 slices/group).

