
Figure 3.
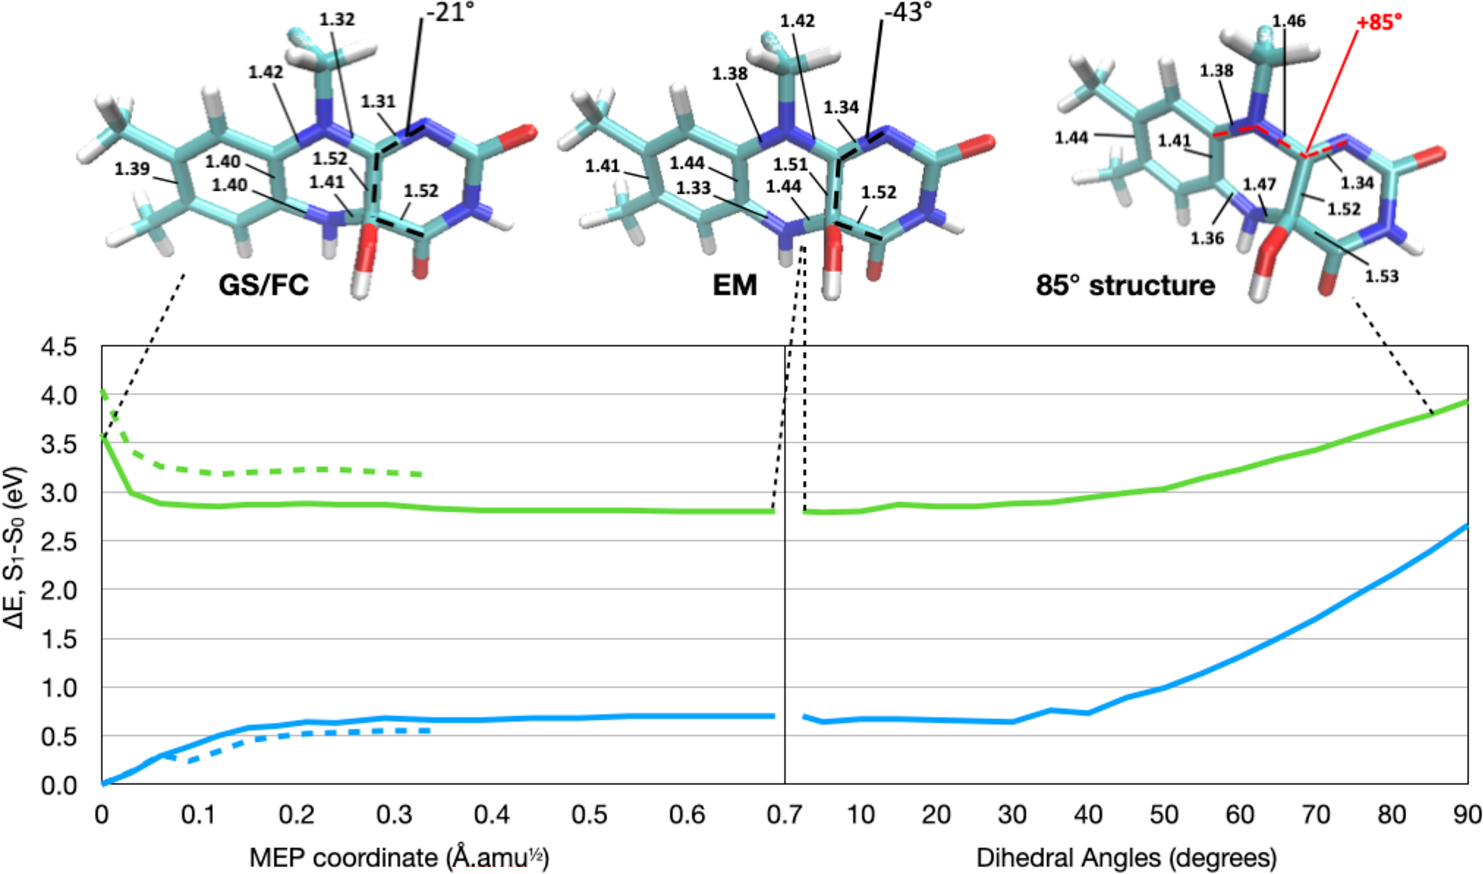
Left: CASPT2//CASSCF S0 (blue) and S1 (green) energy profiles along the MEP connecting the FC to the energy minimum (EM). Calculations obtained with Cys106 in the QM region are shown as solid lines, while calculations with Cys106 in the MM region are shown as dashed lines. Right: The results of the C9a–N10–C10a–N1 dihedral relaxed scan, performed in intervals of 5° starting from the EM. The energy gap between S0 and S1 decreases from 2.1 eV at the EM to 1.3 eV at 90°. Top: Structures of the GS/FC, EM, and 85° constrained structure. All bond lengths that change by more than 0.02 Å during the MEP are labeled for the structures. We also indicate the C4–C4a bond length, which changes minimally. Moreover, we label the C4–C4a–C10a–N1 dihedral, representing out-of-plane distortion of the fluorophore. For clarity, the Cys106 side chain is not included in the structure representations.