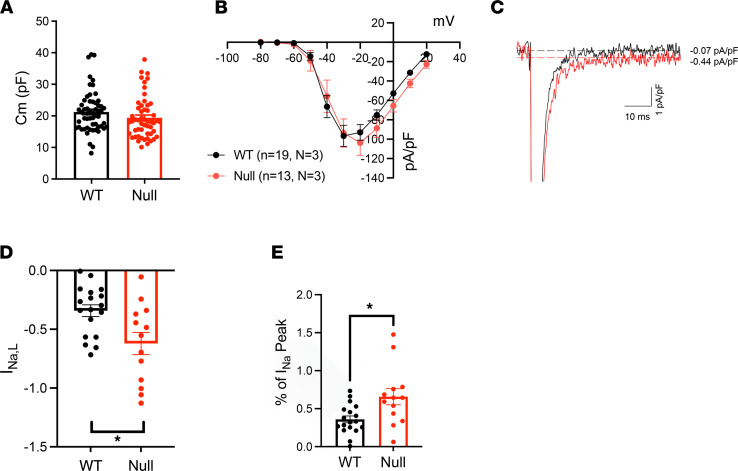
Figure 7. Neonatal Scn1b-null atrial myocytes have increased INa,L.
(A) Membrane capacitance (Cm) of P15–18 WT (black) or Scn1b-null (red) acutely isolated atrial myocytes. Plot shows combined Cm values obtained from the INa, ICa, and IK recordings. (B) I-V relationships for INa,T are similar between genotypes. (C) Superimposed representative INa,L recordings from a WT and null atrial myocyte. (D) Current densities for WT and null atrial myocyte INa,L (pA/pF). (E) INa,L expressed as percentage of INa,T. Each dot represents the value from 1 cell. Data are presented as mean ± SEM. *P < 0.01 versus WT using Student’s t test.

