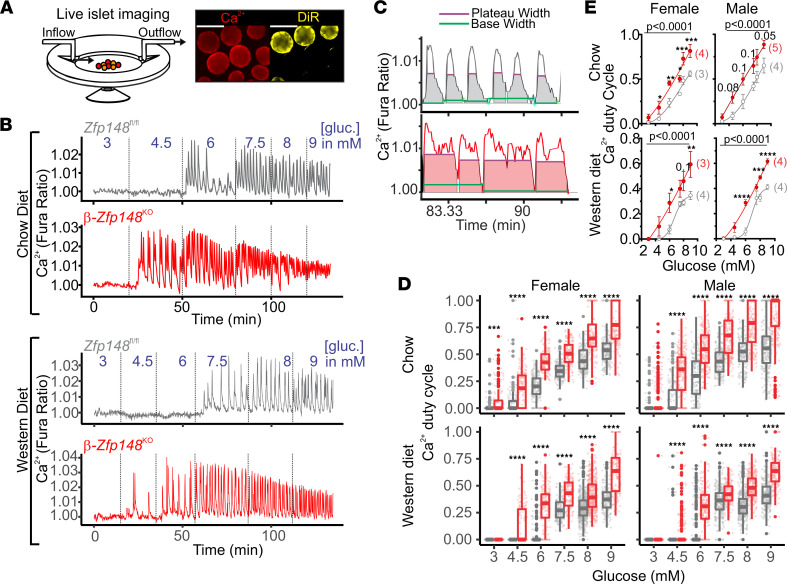
Figure 1. β-Zfp148KO islets show improved glucose sensitivity and altered Ca2+ duty cycle.
(A) Islets from 2 animals were imaged simultaneously during perifusion (left) by labeling 1 animal’s islets with the lipid dye DiR (right; scale bar: 100 μm). (B) Detrended example traces from simultaneously imaged Zfp148fl/fl control and β-Zfp148KO islets using Fura Red. Islets from chow-fed (top) and WD-fed mice (bottom) were imaged during a glucose (gluc) ramp (3, 4.5, 6, 7.5, 8, and 9 mM glucose; transition times shown by dotted lines). (C) MATLAB scripts measure base and peak width for oscillations to determine duty cycle in Zfp148fl/fl control and β-Zfp148KO islets. (D) By-islet duty-cycle measurements from islets of female (left) and male (right) Zfp148fl/fl control and β-Zfp148KO mice fed chow (top) and WD (bottom). Dots indicate individual islet trace values for each condition and gene. Overlaid box plots show summary data (top and bottom edges indicate 25th and 75th percentile, respectively; the 50th percentile is indicated by the midline, and lines on either side mark 1.5× the IQR). Statistical significances (Šidák post tests after 2-way ANOVA, corrected for multiple comparisons) are indicated. (E) By-animal dose-response curves derived from average duty-cycle measurements for β-Zfp148KO and littermate control mice for the conditions in D. The number of animals analyzed per group is indicated in parentheses. Mean ± SEM are plotted, with the line representing the sigmoidal dose-response curve determined using PRISM. Statistical comparisons of fitted curves are shown above the curves, as determined using extra sum-of-squares F test. (D and E) *adjusted P < 0.05, **adjusted P < 0.01, ***adjusted P < 0.001, and ****adjusted P < 0.0001. Subthreshold P values for point comparisons in E are indicated above the relevant points. These data were derived from ≥140 islets from ≥3 mice per sex per diet per genotype. Islet and animal distributions per group are in listed in Table 1.

