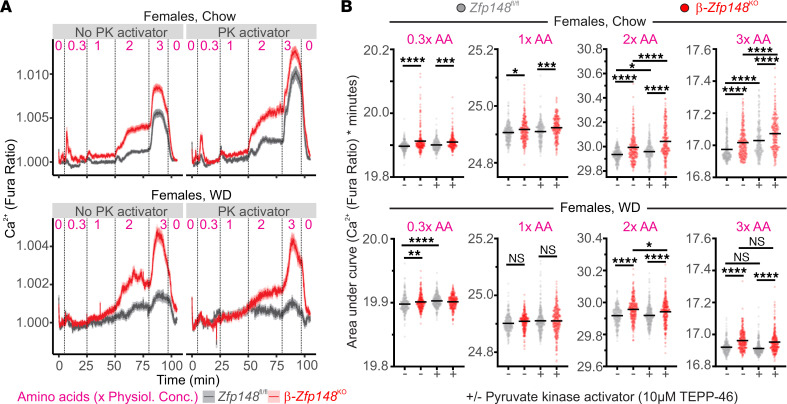
Figure 2. β-Zfp148KO islets show altered amino acid sensitivity.
(A) Average Ca2+ traces from islets of female chow-fed (top) and WD-fed (bottom) β-Zfp148KO and littermate control mice during amino acid (AA) ramps (numbers above the traces indicate concentration of the 12 amino acids in the mix relative to their physiological concentrations (physiol. conc.; e.g., 1× indicates physiological levels in plasma) with and without pyruvate kinase (PK) activator (10 μM TEPP-46). All solutions contained 3 mM glucose. Dotted lines indicate transitions between solutions. (B) AUC analysis of islet traces during the amino acid ramps. Concentrations of the amino acids are indicated above the graphs. Data in the top and bottom panels are from the chow-fed and WD-fed mouse islets, respectively. There are ≥237 islets from 5–7 mice per group per diet. The islet and animal distributions for each group are indicated in Table 1. (B) Data from individual islet traces are indicated as points and the lines indicate the mean; *P < 0.05, **P < 0.01, ***P < 0.001, and ****P < 0.0001. Data were analyzed by Tukey post tests after 1-way ANOVA and P values were adjusted for multiple comparisons.

