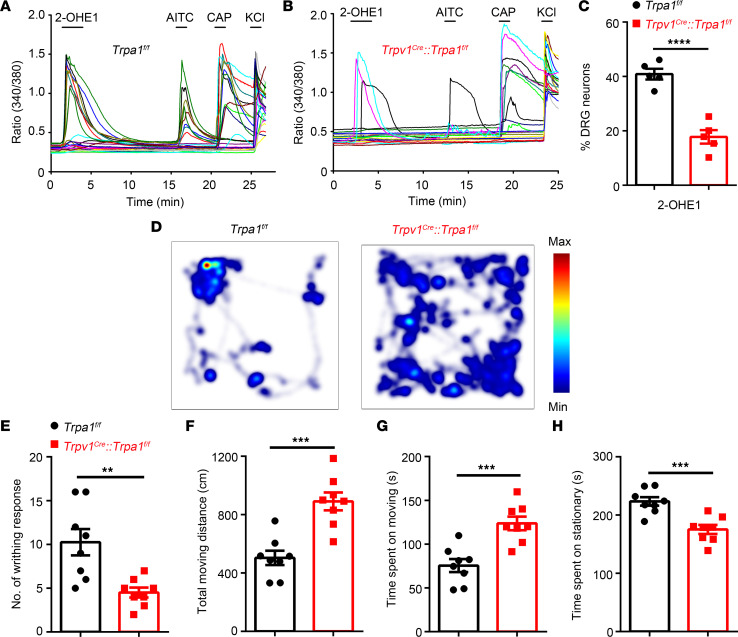
Figure 10. Conditional KO TRPA1 from TRPV1-positive nociceptors significantly inhibits pain-related behaviors in a mouse model of uterine pain.
(A and B) Representative time-lapse trace of 2-OHE1–induced [Ca2+]i response in DRG neurons isolated from Trpa1fl/fl mice (A) and Trpv1Cre Trpa1fl/fl mice (B). (C) Percentage of DRG neurons responding to 2-OHE1 in DRG neurons isolated from Trpa1fl/fl mice and Trpv1Cre Trpa1fl/fl mice. n = 5 coverslips from 3 mice per group. ****P < 0.0001, unpaired t test. (D) Representative images illustrate heatmaps of voluntary movements of Trpa1fl/fl (left) and Trpv1Cre Trpa1fl/fl mice (right) subjected to 3 days of estrogen treatment followed by oxytocin treatment. (E–H) Statistical data show the number of writhing responses (E), total moving distance (F), total time spent moving (G), and total time spent stationary (H) in Trpa1fl/fl and Trpv1Cre Trpa1fl/fl mice subjected to 3 days of estrogen treatment followed by oxytocin treatment. n = 8 mice per group. **P < 0.01, ***P < 0.001, unpaired t test.

