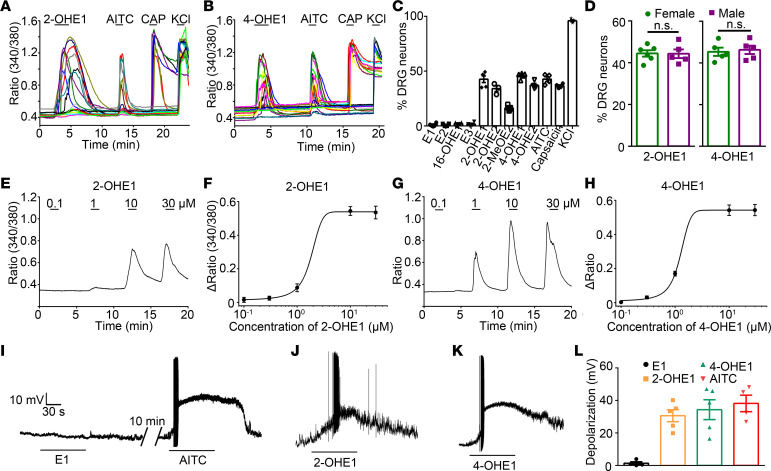
Figure 2. Estrogen metabolites 2- and 4-HEMs directly activate DRG neurons.
(A and B) Representative time-lapse traces of 2-OHE1– (A) and 4-OHE1–induced (B) [Ca2+]i responses in DRG neurons from WT mice. (C) Percentage of DRG neurons responding to estrogen and its metabolites. n = 5 mice (>200 neurons each). (D) Percentage of DRG neurons isolated from female and male mice responding to 2- and 4-OHE1. n = 5 to 6 coverslips per group from 4 mice (>150 neurons each). (E–H) Representative [Ca2+]i responses and dose-response curves of [Ca2+]i responses in DRG neurons from WT mice responding to different concentrations of 2-OHE1 (E and F) and 4-OHE1 (G and H). (I–K) Representative voltage traces show membrane potential depolarization and action potential firing in DRG neurons isolated from WT mice induced by E1 (I), 2-OHE1 (J), and 4-OHE1 (K). (L) Quantification of E1, 2-OHE1, 4-OHE1, and AITC-induced membrane potential depolarization in DRG neurons isolated from WT mice. n = 4 to 5 from 3 mice.

