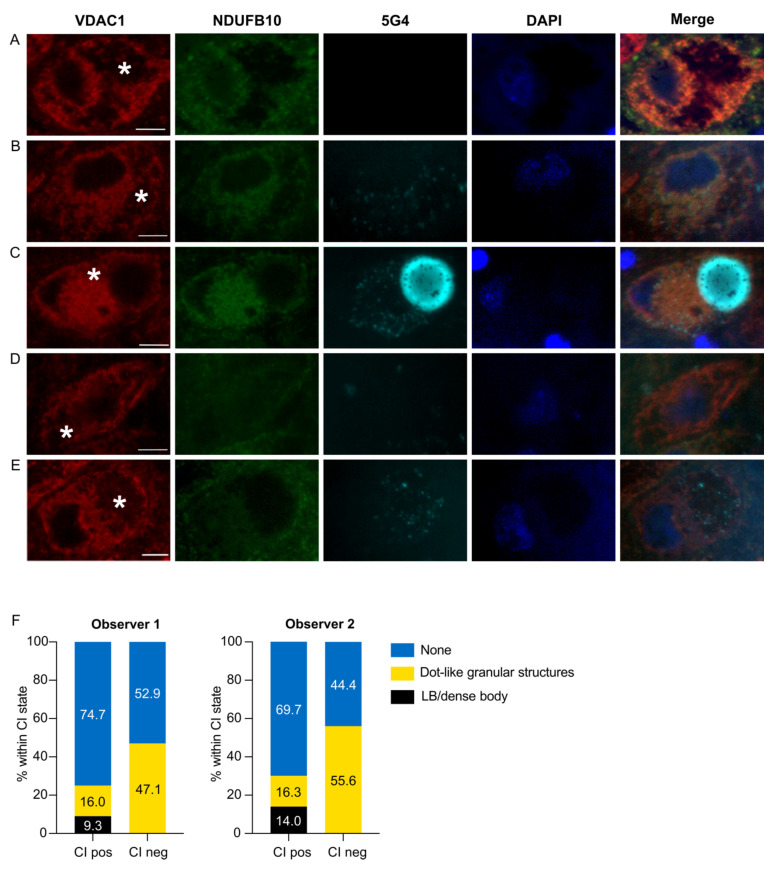
Figure 2.
Immunofluorescence staining for CI and aggregated -synuclein in dopaminergic neurons of the SNc. The images show representative examples of fluorescence immunoreactivity against the mitochondrial outer membrane marker (VDAC1, red), CI (NDUFB10, green), aggregated -syn (5G4, cyan), dsDNA (DAPI, blue), and a combination of all channels. CI-positive neurons were either 5G4-negative (A), or 5G4-positive with punctate inclusions (B) or LB/PB (C). CI-negative neurons were either 5G4-negative (D), or positive with punctate inclusions (E). Neuromelanin is marked with an asterisk. Scale bar: 10 microns. The plots in (F) depict the total percentage of neurons in each -syn inclusion state (LB or PB/punctate inclusions/no inclusion) within each CI state (positive/negative) from each of the observers.

