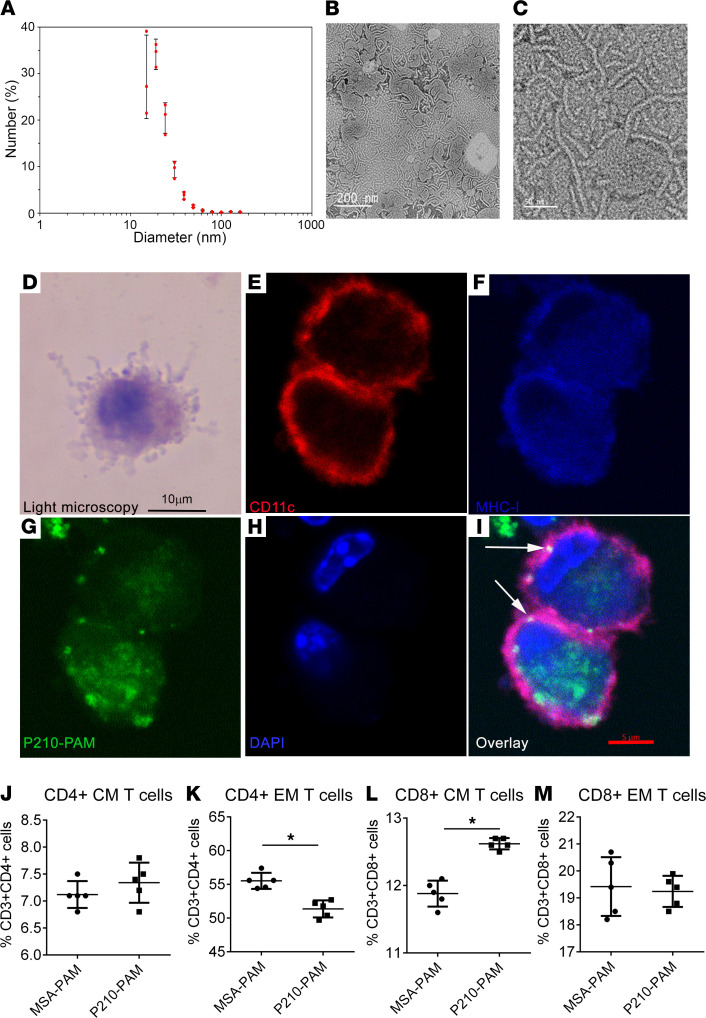
Figure 3. P210-PAM nanoparticles.
(A) The majority of P210-PAMs are between 15 and 25 nm (n = 3). Transmission electron microscopy of P210-PAM at low (B) and high (C) magnification. Scale bars: 200 nm (B), 50 nm (C). (D) Light microscopy of Giemsa-stained mouse BMDCs. Fixed BMDCs stained with (E) CD11c PE, (F) MHC-I APC, (G) FITC-P210-PAM, and (H) DAPI. (I) Color overlay and arrows indicating costaining. The last lysine of the P210 peptide was FITC labeled prior to PAM assembly. The experiment was replicated twice with similar results. Scale bars: 10 μm (D–F), 5 μm (G–I).(J) CD4+ central memory (CM) T cells, (K) CD4+ effector memory (EM) T cells, (L) CD8+ CM T cells, and (M) CD8+ EM T cells from spleens of 25-week-old ApoE–/– mice fed a high-cholesterol diet for 16 weeks. Splenocytes were collected after 48 hours’ treatment with 20 μg/mL MSA-PAM or P210-PAM. n = 5 each, *P < 0.05 by 2-tailed t test.

