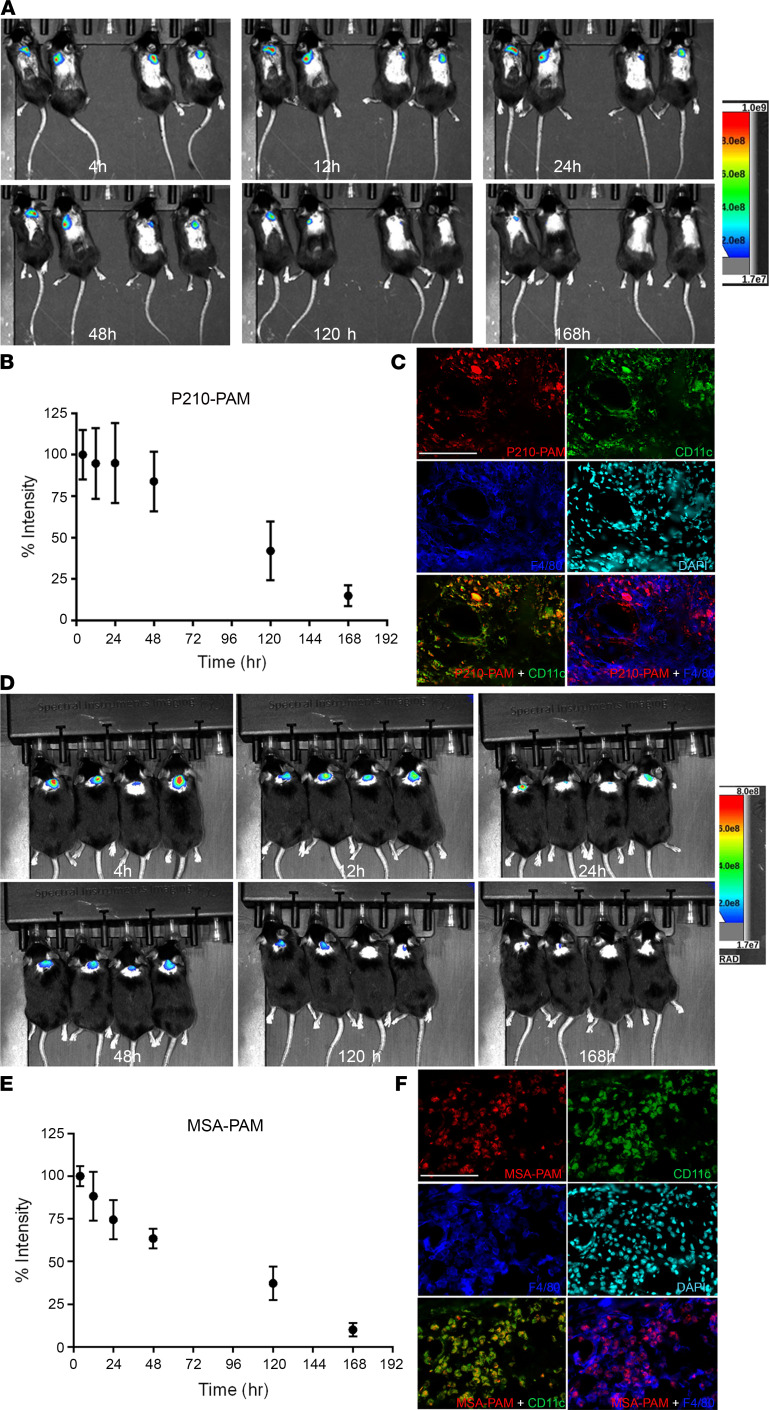
Figure 4. PAM imaging and retention in vivo.
In vivo imaging of P210-PAM (A–C) or MSA-PAM (D–F) retention at the injection site of C57BL/6J mice over 168 hours. Percentage of signal intensity relative to time 0 (immediately after injection) of P210-PAM (B) or MSA-PAM (E). n = 4 each. Colocalization of fluorescently labeled P210-PAM (C) or MSA-PAM (F) with F4/80+ macrophages and CD11c+ DCs at the injection site at 48 hours.

