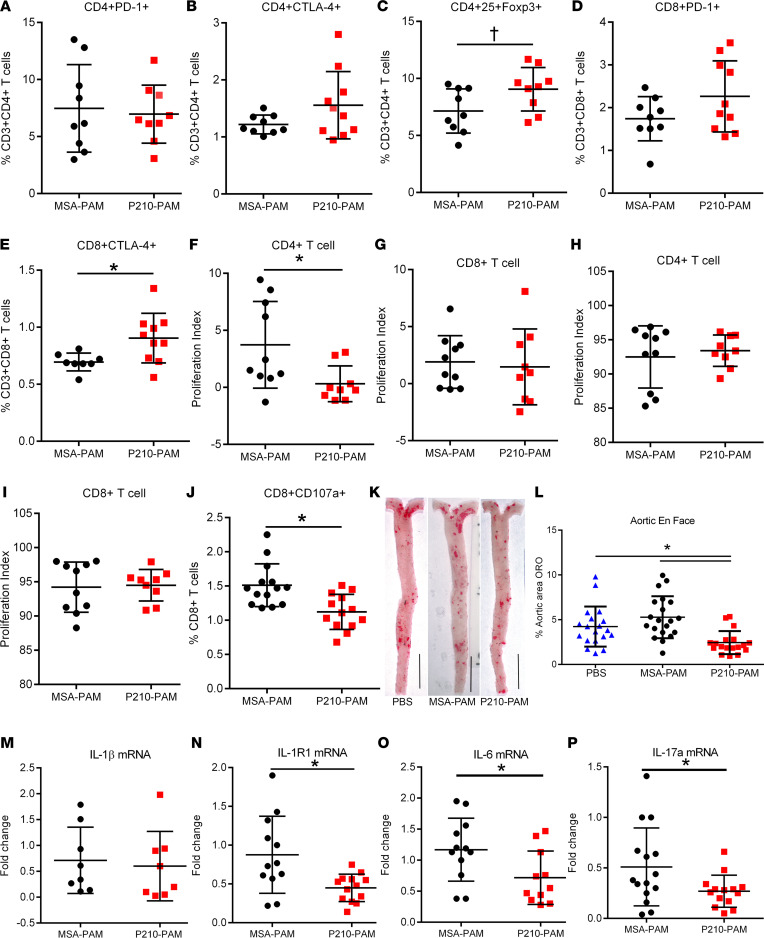
Figure 5. P210-PAM immunization in ApoE–/– mice.
(A–C) Immune regulatory profile of CD4+ and (D and E) CD8+ T cells in splenocytes of immunized mice 1 week after second booster. (F and G) Splenic T cell proliferation of immunized mice in response to P210 peptide or (H and I) Concanavalin A (Con A) stimulation assessed by BrdU staining. (J) CD107a to assess CD8+ T cell cytolytic activity in splenocytes of immunized mice. (K) Representative photographs of aortic en face staining with oil red O at 25 weeks of age. (L) Atherosclerosis measured as percentage of whole aorta stained by oil red O. Splenic mRNA expression of (M) IL-1β, (N) IL-1R1, (O) IL-6, and (P) IL-17a. Number of mice used in each group is represented by the number of dots in individual figure. *P < 0.05; †P = 0.05, 2-tailed t test except for L, 1-way ANOVA with Holm-Šidák multiple comparisons test.

