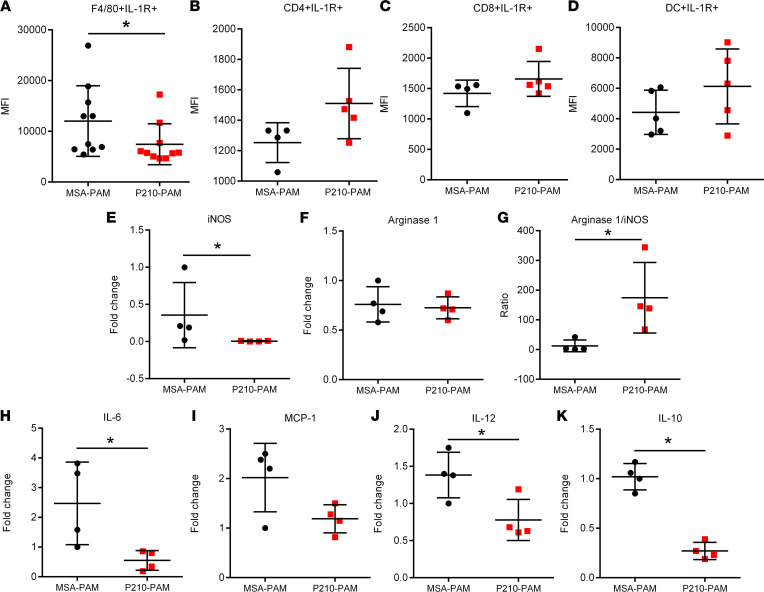
Figure 6. Macrophage phenotype in P210-PAM–immunized ApoE–/– mice.
Splenic IL-1R1 expression measured by MFI in (A) F4/80+ monocyte/macrophage cells, (B) CD4+ T cells, (C) CD8+ T cells, and (D) DCs. Macrophages isolated from the peritoneal cavity of immunized mice elicited by thioglycolate injection assessed for (E) iNOS and (F) arginase 1 mRNA expression. (G) Ratio of arginase 1 to iNOS mRNA expression. Macrophages were further phenotyped using mRNA expression of (H) IL-6, (I) MCP-1, (J) IL-12, and (K) IL-10. Number of mice used in each group is represented by the number of dots in individual figure. *P < 0.05 Mann-Whitney except for J and K, which were analyzed by 2-tailed t test.

