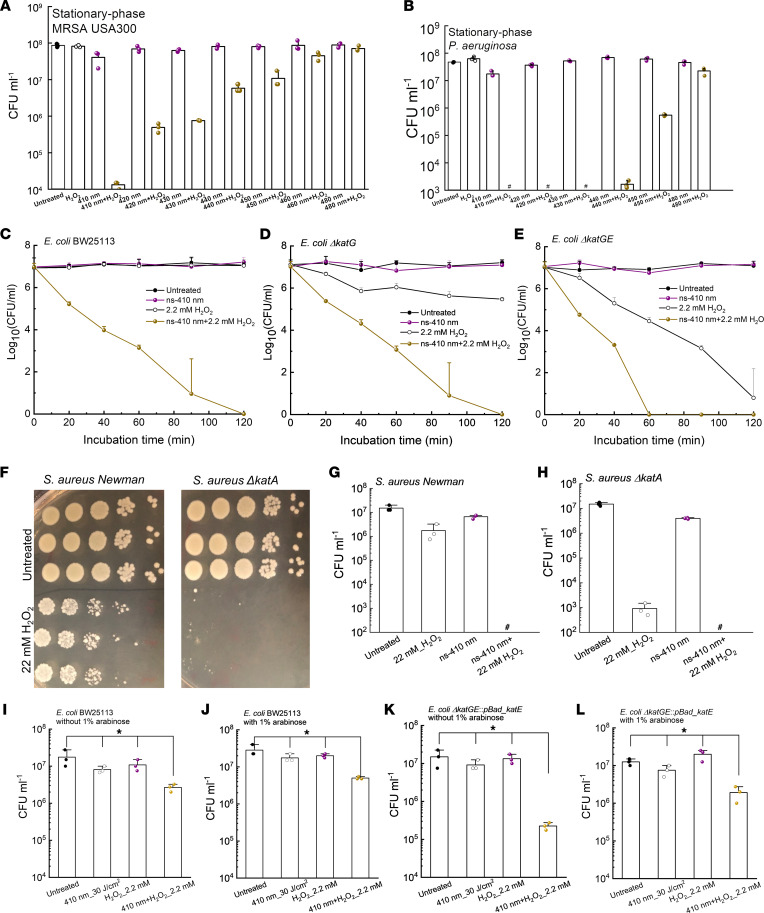
Figure 2. Photoinactivation of catalase effectively sensitizes pathogenic bacteria to H2O2.
(A) CFU/mL of stationary-phase MRSA USA300 under various treatments. Dose: 50 mW/cm2, 5 minutes. H2O2: 22 mM, 30-minute incubation time. (B) CFU/mL of stationary-phase P. aeruginosa PAO1 under various treatments. Dose: 50 mW/cm2, 5 minutes. H2O2: 22 mM, 30-minute incubation time. (C–E) Time-killing curves of wild-type E. coli BW25113 (C), E. coli ΔkatG (D), and E. coli ΔkatGE (E) under different treatment schemes. ns-410 nm: 30 mW, 8 minutes, 14 J/cm2. (F) CFU plates of S. aureus Newman along with its isogenic catalase-mutant S. aureus ΔkatA with/without H2O2 treatment. (G and H) CFU/mL of S. aureus Newman (G) and S. aureus ΔkatA (H) under different treatment schemes. (I–L) Viable E. coli BW25113 (I and J) and E. coli ΔkatGE:pBad_katE (K and L) were enumerated after incubating with/without H2O2 (2.2 mM) for 30 minutes in the absence/presence of arabinose (4 hours) after 3 J/cm2 410 nm treatment. Data: Mean + SD from at least 3 biological replicates for all panels. Pound sign indicates the CFU results are below the detection limit. Statistical analysis was obtained by Student’s 2-tailed unpaired t test (compared with the untreated group) and 1-way ANOVA. *P < 0.05.

